

QuiCQ 01/10/2025
Shutdown


“Suppose you were an idiot. And suppose you were a member of Congress. But I repeat myself.”
— Mark Twain
Enjoying The QuiCQ but not yet signed up for The Quotedian? What are you waiting for?!!


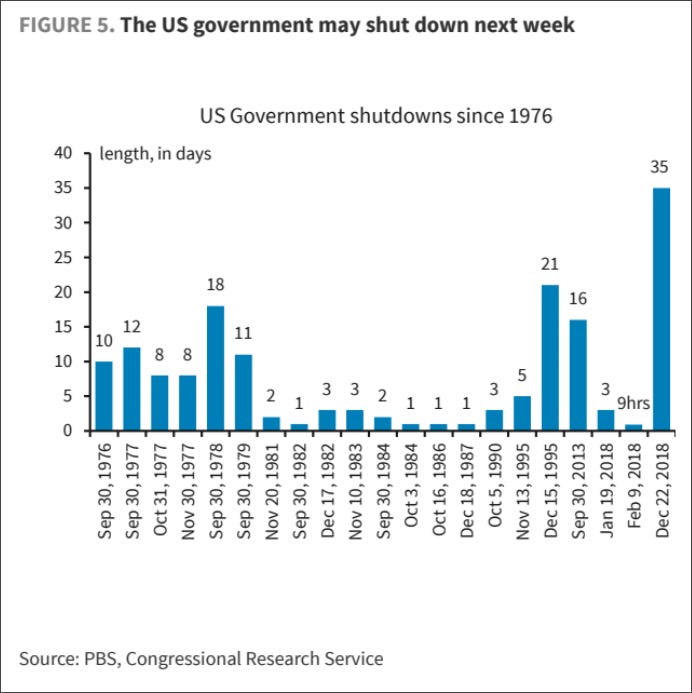
As ABBA used to sing: “My, my, here we go again …” and so we have another US government shut down. But hang on! It has actually been seven years since the last one! Though I have checked with my friend Wilson (aka ChatGPT), and there have eleven 11-th hour (coincidence?) avoidances of shut downs since that previous one. And to be precise, the previous one was on December 22, 2018 and lasted until January 25, 2019 - same full 35 days and hence making it the largest shutdown in US history. FWIW, here is a chart from Barclays showing the length of previous shutdown periods:
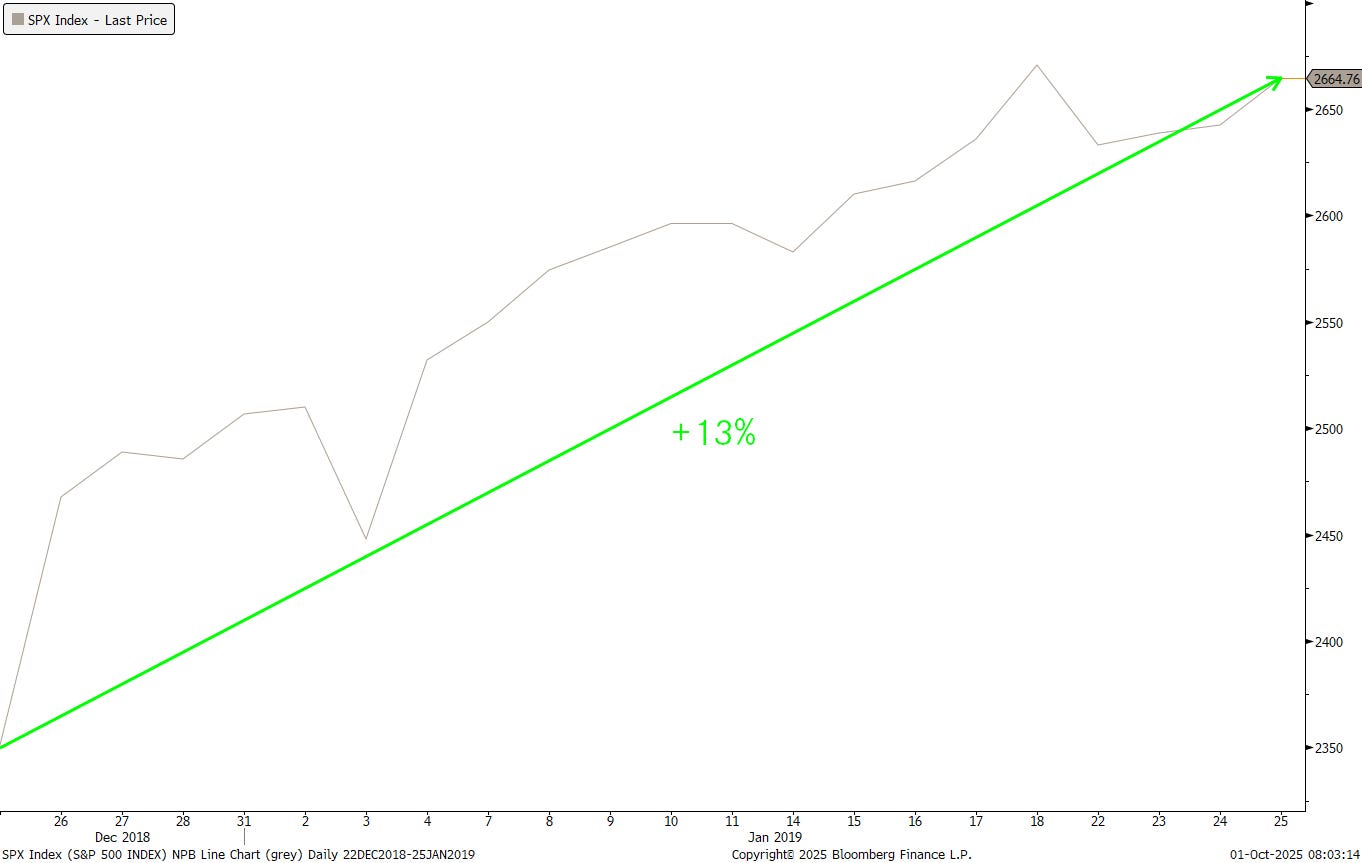
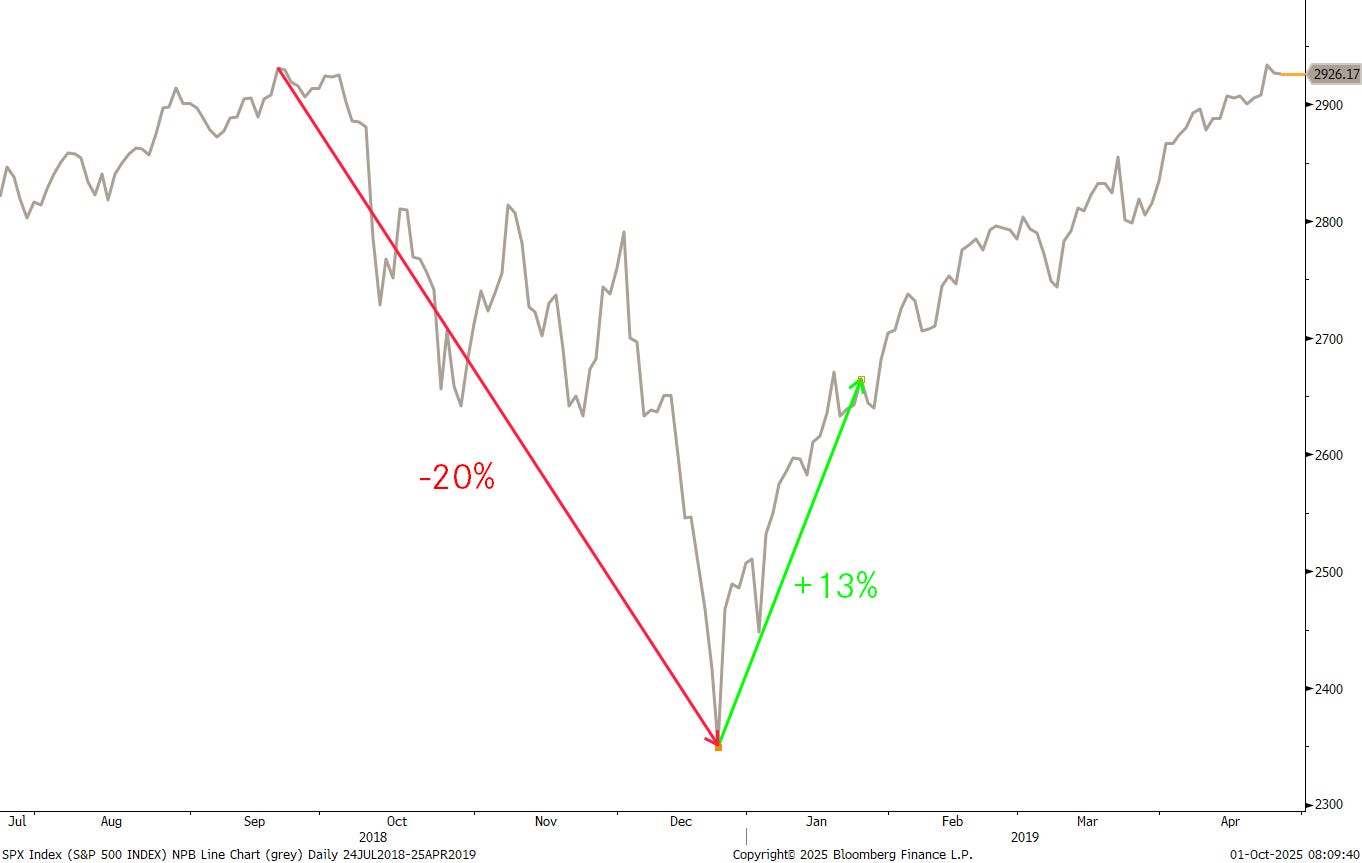
What did the market do during that last, longest shutdown period in 2018/2019? Here’s the S&P 500 over that period:
And this is the path of US 10-year yields during the same period:
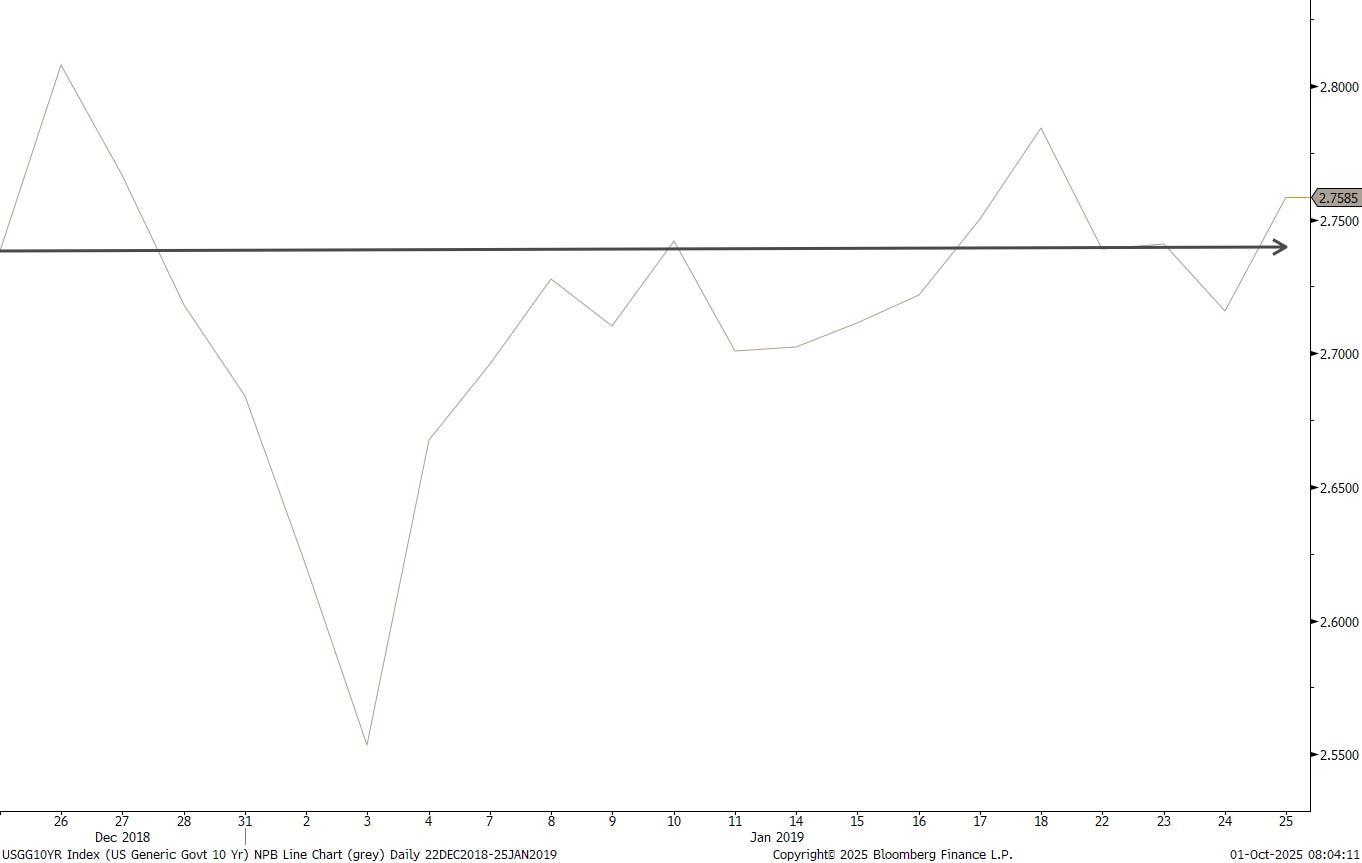
Whilst yields did bugger all, stocks actually climbed 13%. However, we need to put this into the context that the government shutdown coincided precisely with the end of Volmageddon 2.0, as one Fed Chair named Jerome Powell privately reassured Treasury Secretary Steven Mnuchin and markets that the Fed would be “patient” and flexible on rate hikes and the balance sheet. Here’s a zoom-out on the previous S&P 500 chart for context of that period:
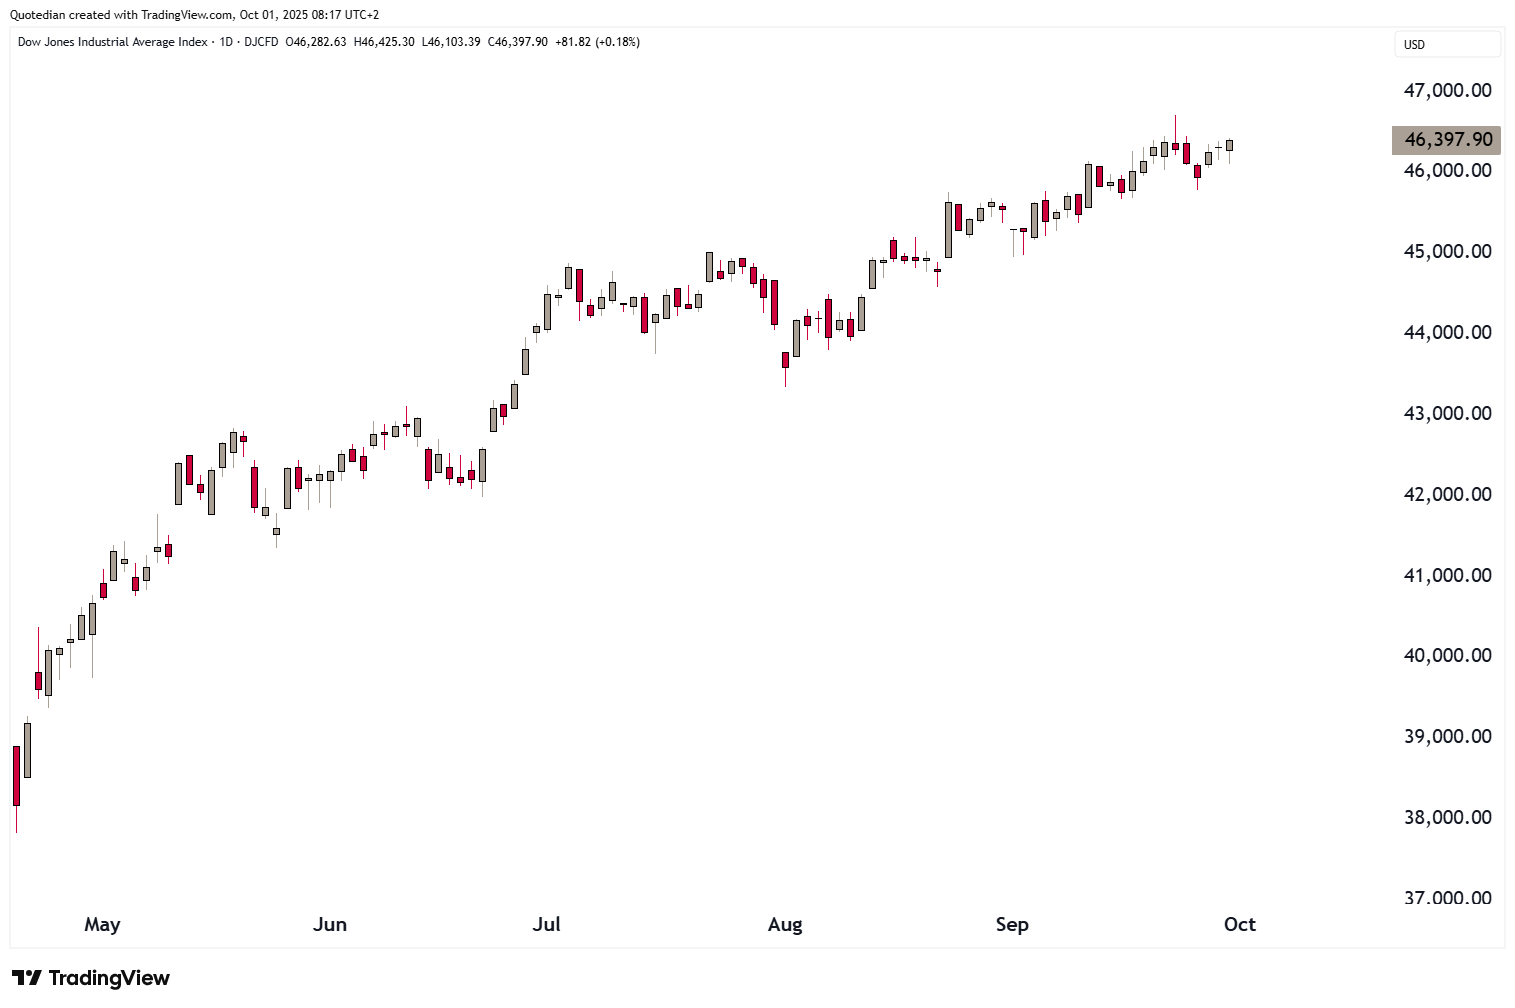
Anyway, yesterday, pre-shutdown US (and European) markets closed higher, in the case of the Dow Jones Industrial high enough to mark yet another new all-time high:
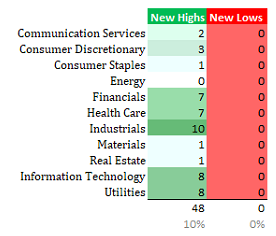
Breadth for the session was pretty decently tilted towards the positive side, with three stocks up for every decliner (S&P 500) and no new 52-week lows in comparison to 48 index constituents hitting a new 52-week high. That does not seem too bearish. The new highs were widely spread amongst industrials, utilities, tech stocks, financials and healthcare:
Bond yields, similar as during the last shutdown, have so far reacted fairly unimpressed. Here’s the daily chart of the US 10-year yield:
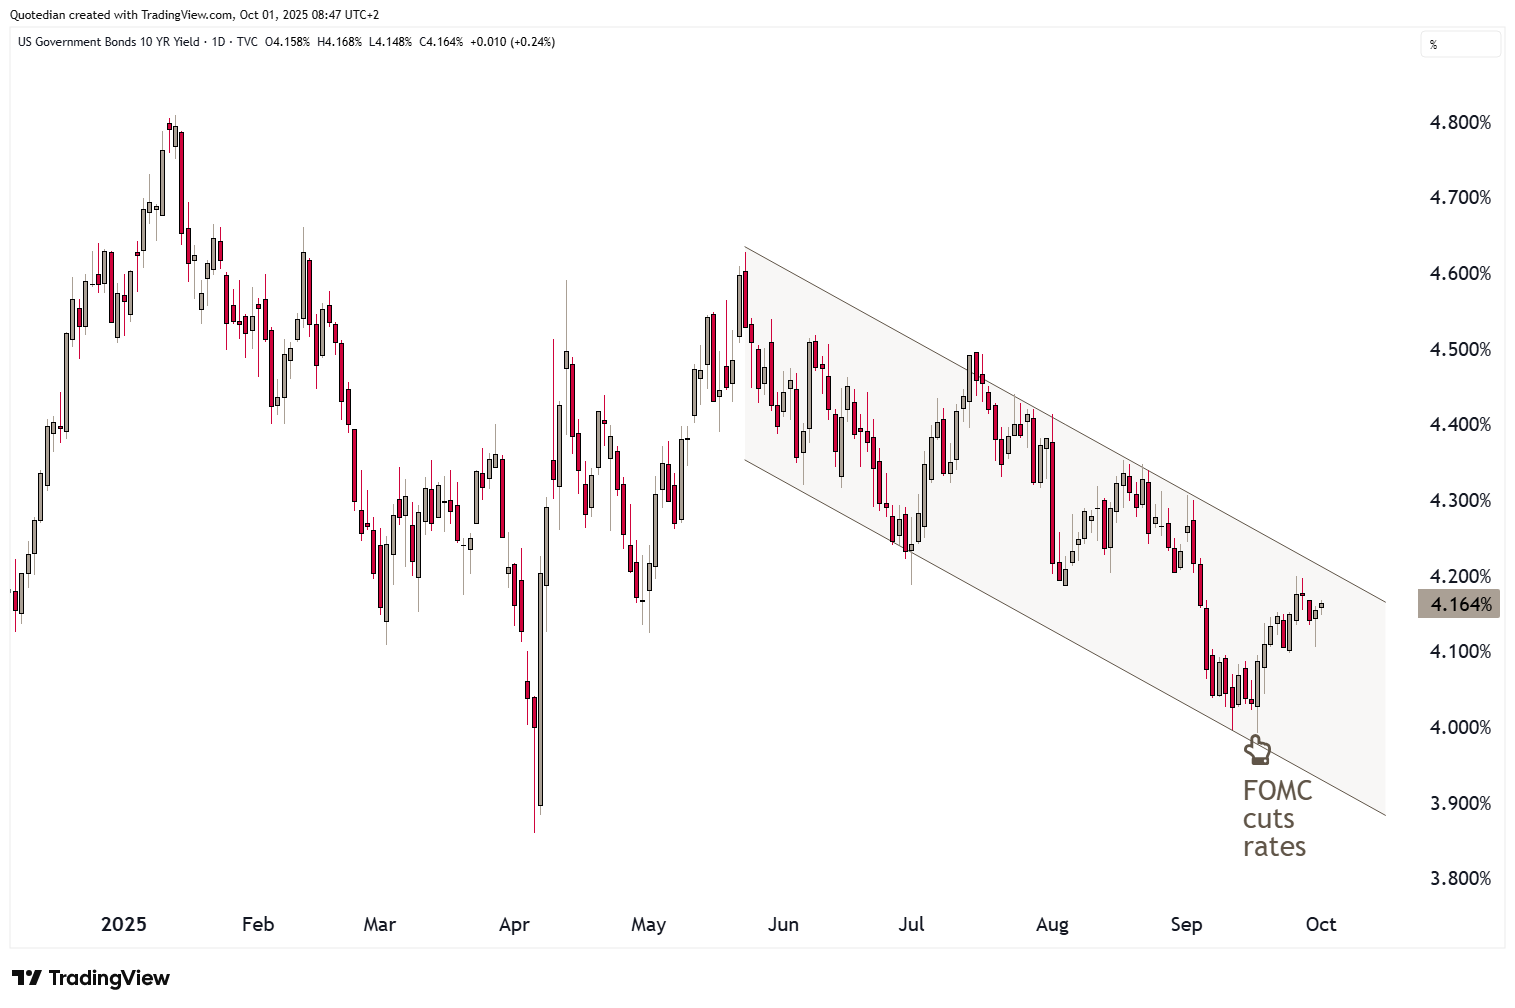
This is actually a fairly interesting chart, as a move out and above the trend channel at 4.20 could mean an end to the current cycle of lower yields - to the contrary a move below 4% would be on the books then. But this is something we should discuss in next weekend’s Quotedian:
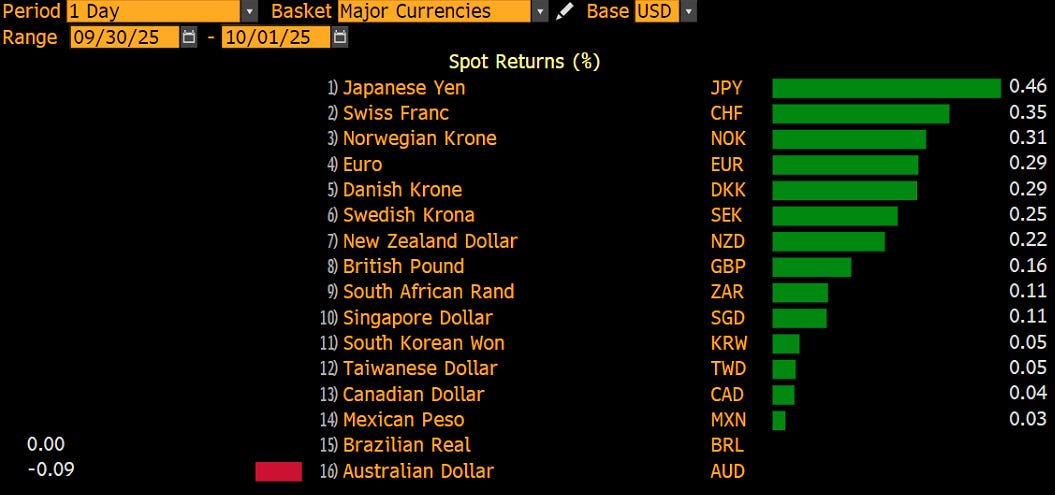
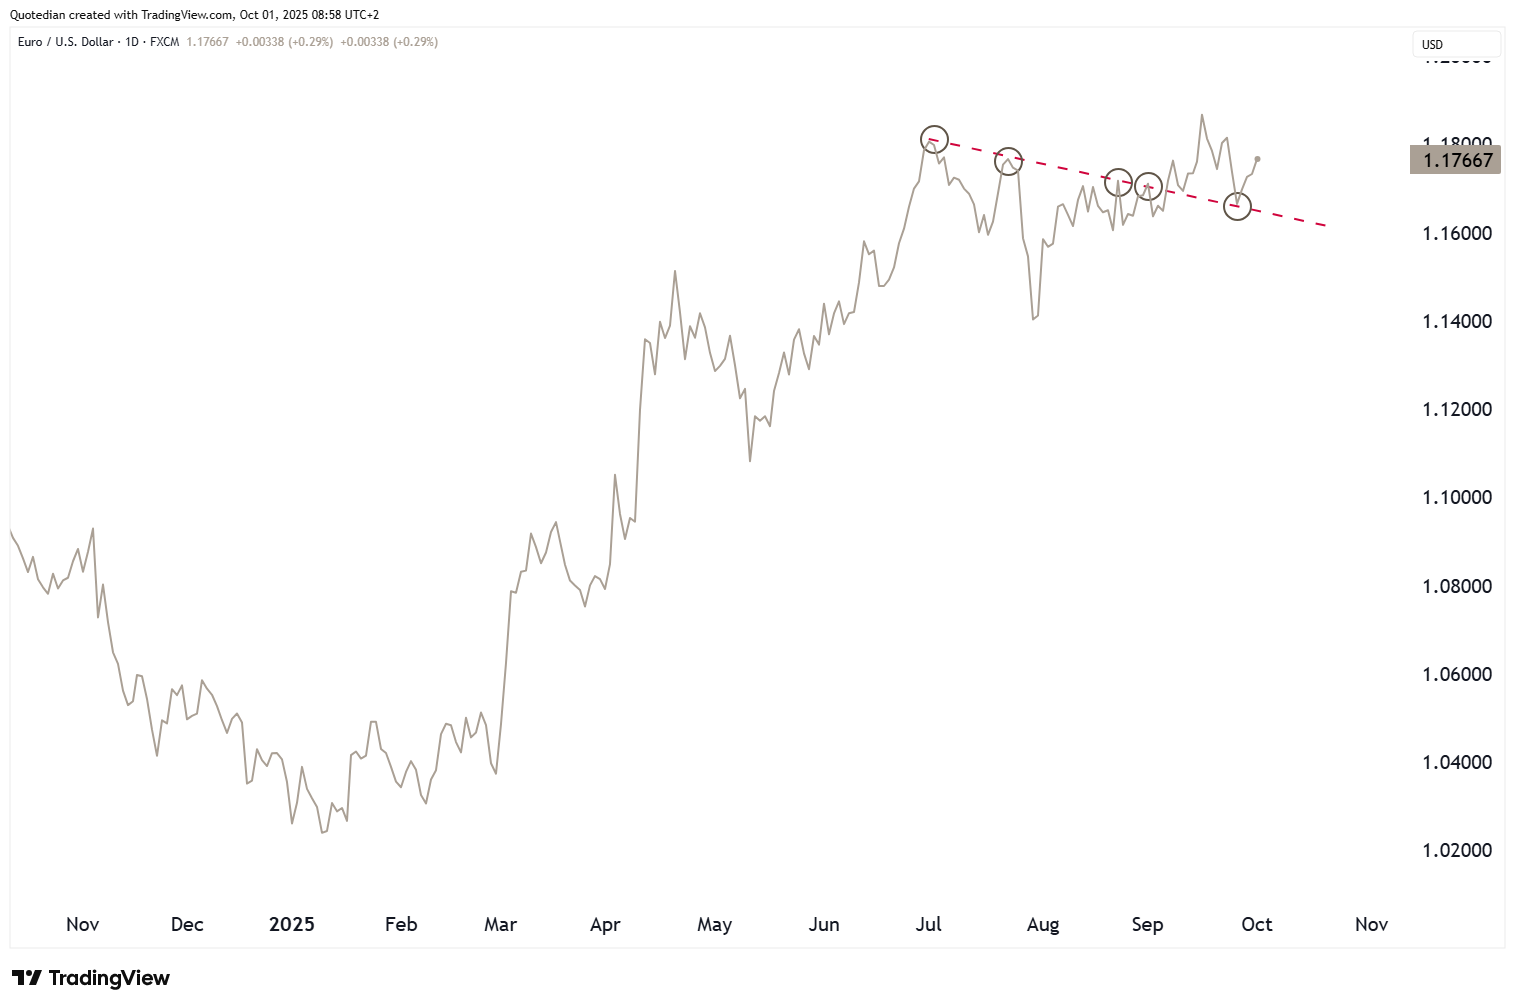
The Dollar had a soft day against other major currencies yesterday,
and especially versus the Euro an interesting pattern has emerged surrounding a previous resistance line (red dashed) now turned support:
One last detail on the US Government shutdown before we head off into the trading day … any US economic data provided by a government agency, including the BLS’ non-farm payroll due this Friday, is now clearly under jeopardy of not being reported:
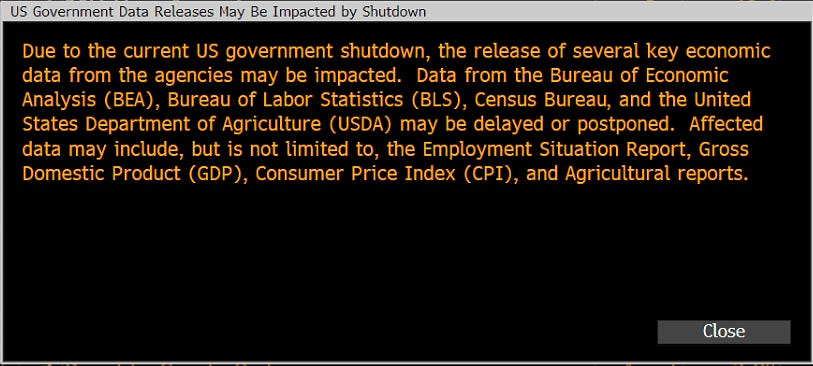
Again, FWIW.
Time to hit the send button - have a great Wednesday!

The possibility that the 10-year yield could breach 4.20% and reverse the downtrend is the key macro tipping point I’ll be watching now.