

QuiCQ 04/04/2025
Of Penguins and Volcanoes


“The price good men pay for indifference to public affairs is to be ruled by evil men.”
— Plato
Enjoying The QuiCQ but not yet signed up for The Quotedian? What are you waiting for?!!


Where to start …
There are several takeaways from yesterday's Trump Tariff Tantrum – none of them is good, with the maths behind the tariffs probably amongst the worst. FT’s Alphaville had a good example:
Here’s what the White House and its crack team of trade investigators seems to have done: Take the US’s goods trade deficit with any particular country, and divide it by the total amount of goods imported from that country. Cut that percentage in half, and there’s the US’s “reciprocal” tariff rate.
They went on:
Let’s look at Bangladesh as an example. The US imported $8.4bn of goods from Bangladesh in 2024, giving it a $6.2bn trade deficit with the country. 6.2 divided by 8.4 is 0.738.
Hence the country has charged tariffs of 74% against the US, “including currency manipulation and trade barriers”.
Now, imagine a small country that exports bananas or coffee to the US - two pretty basic goods which do not grow in commercial quantities on US soil …
But here’s one the more humorous details from Wednesday’s Trump Tariff Tantrum (TTT) and, unfortunately, also one of the more dangerous ones, as it demonstrates the incompetence of the current US administration.
Consider this:
“The Island of Heard and McDonald gets slapped with a 10% baseline tariff on its exports to the US.”
This is the Island of Heard and McDonald seen from above:

This is where it is located:
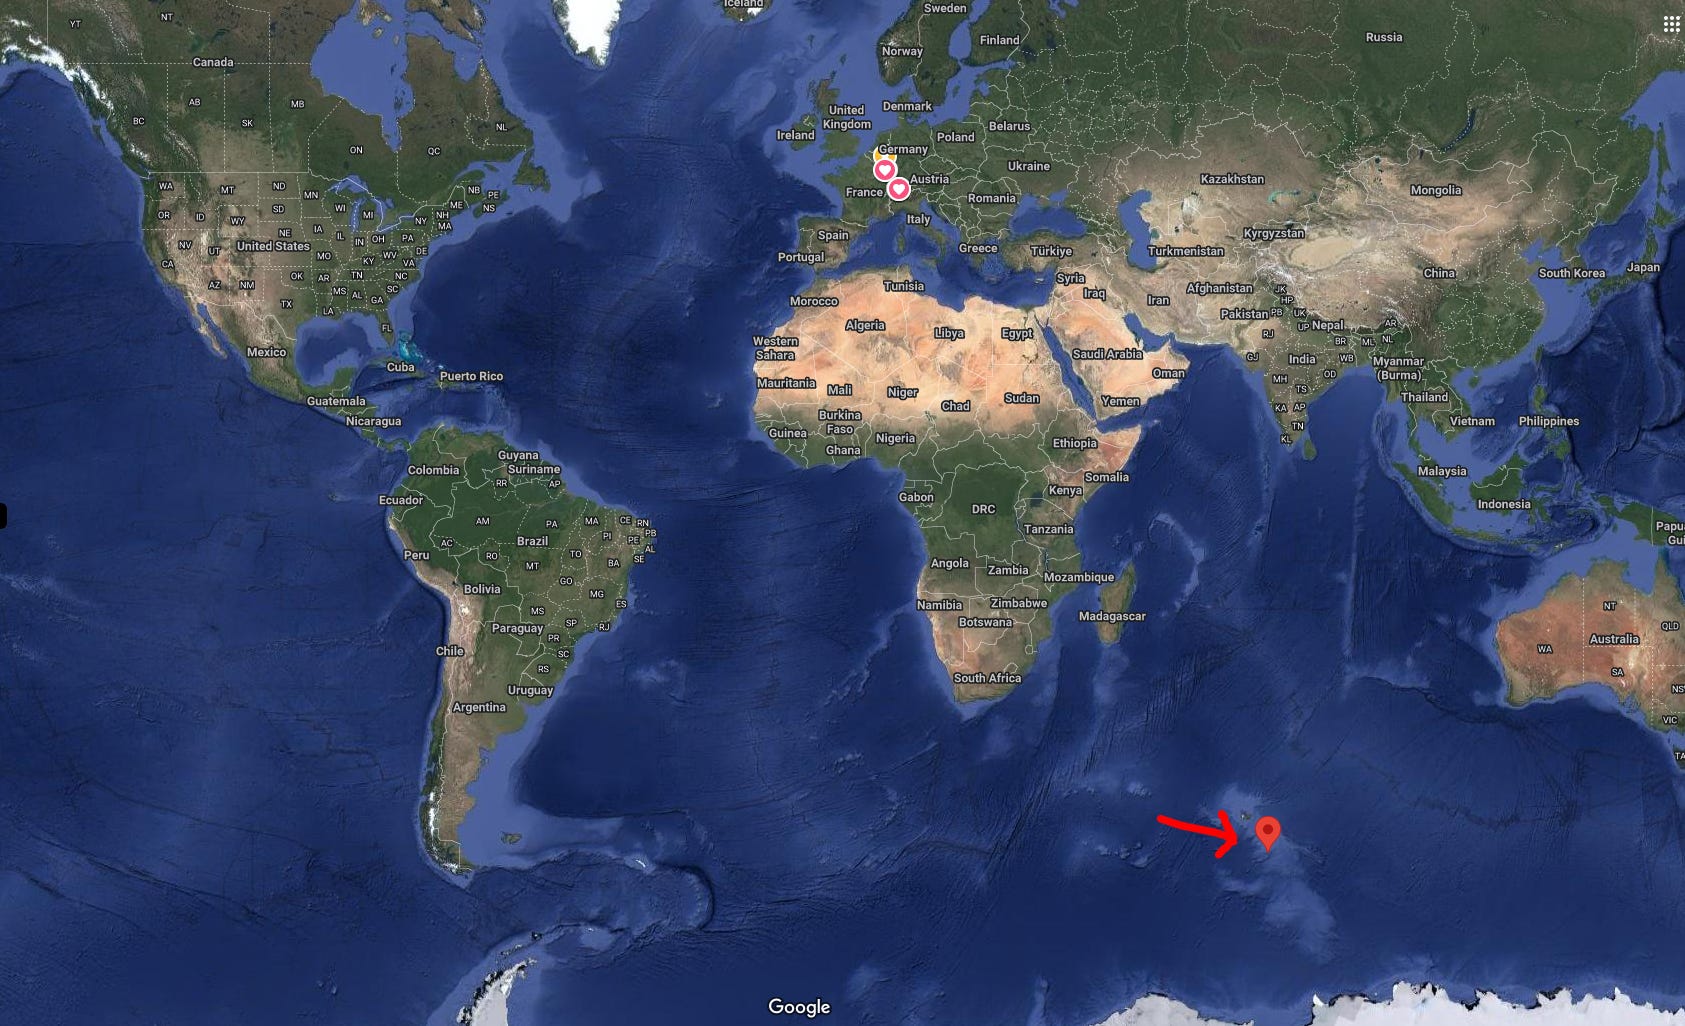
This is the population size of Heard and McDonalds:
0
(if you do not count the two volcanos and about 3 million penguins)
This leaves us with two questions:
What were they thinking?
One wonders which of the volcanoes will retaliate first.
Onwards …
Plenty of market observations to be made … I will need to omit some and am sure I’ll forget some others …
If you’d like to highlight an obvious one I have left out, leave a note in the comment section by pressing on the button below,
and I will try and cover it in Sunday’s Quotedian.
First and foremost of course, all eyes were on equity markets. Here’s the table of US and European markets from yesterday of the my intraday screen:

Heavy losses all around, but noticeably so more in the US than in Europe.
In the S&P 500, more than 80% of constituents were down on the day

and 20% of the stocks directly hit a new 52-week low, with concentration amongst tech stocks:

Surprisingly, out of eleven sectors, one actually eked out a gain on the day:

Consumers staples were sought after as “safe haven” investments.
Talking of safe haven, (bond) duration was heavily bid, as investors stampeded into government bonds. Here’s the chart of the US 10-year yield, trading below 4% first time in a while this early Friday:

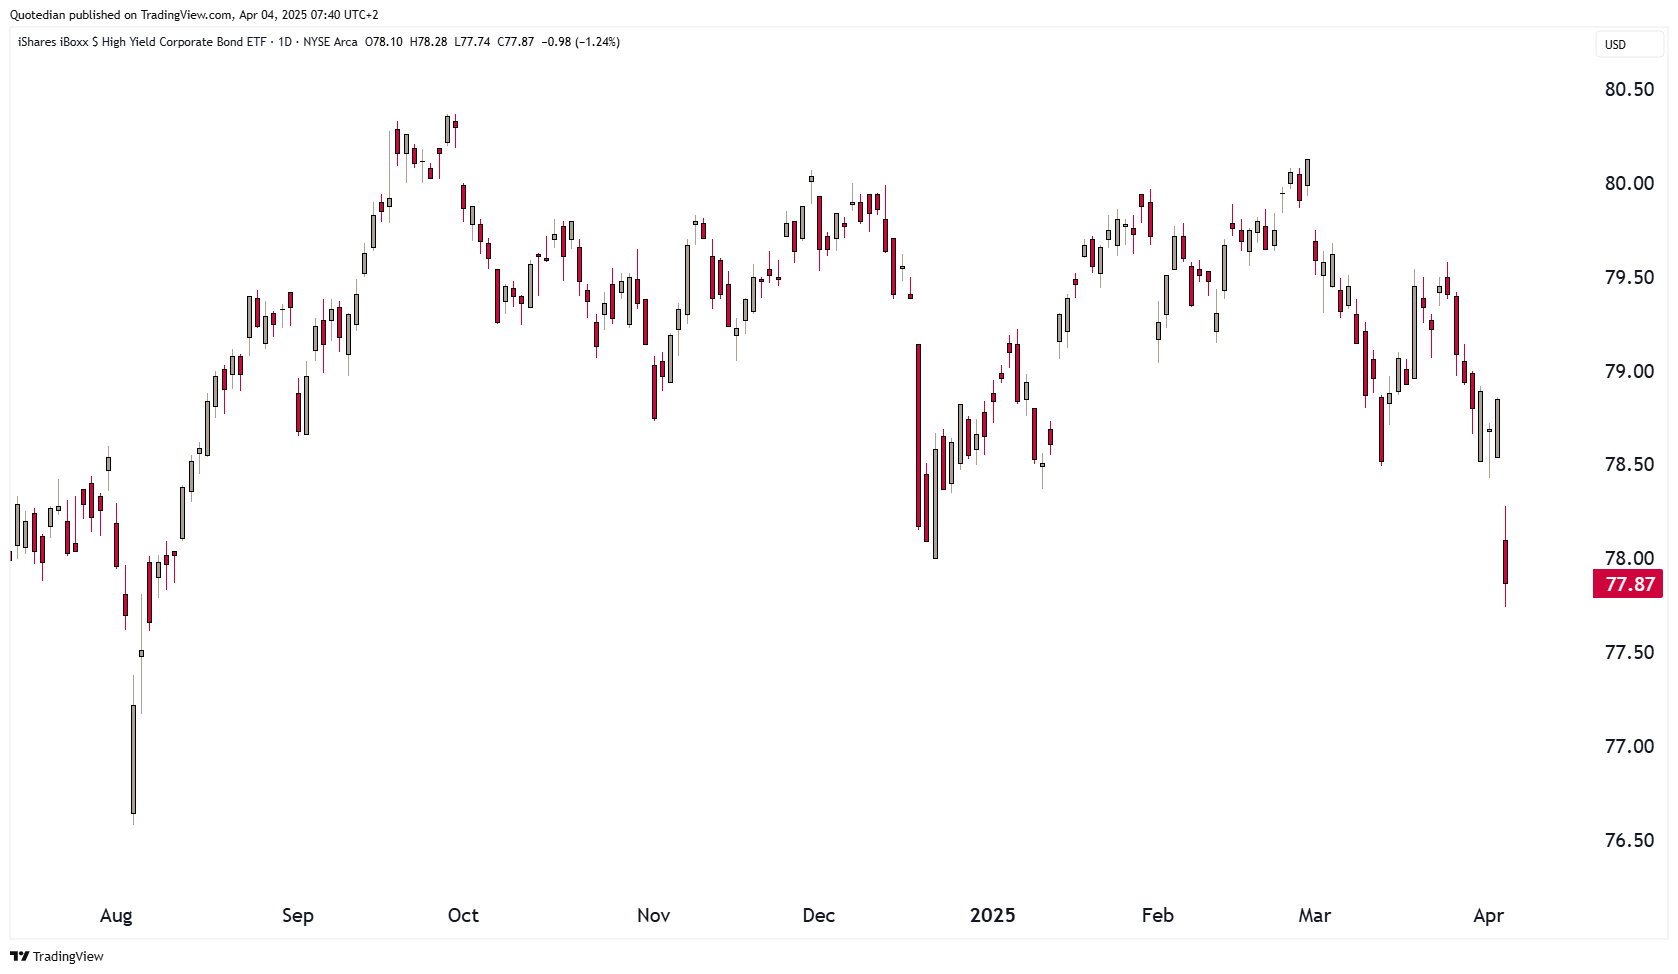
But not all bond investments are born equal, and high yield bonds (aka junk bonds) where heavily under pressure just as their next in kin equities. Here’s the iShares High Yield Bond ETF:
Remember that US 10-year Treasury yield graph, two charts higher? Well, here is Japan’s JGB equivalent:

That’s a 40 basis point drop in seven sessions, or a 30 basis point drop in the last three!
And now, have a look at the USD/JPY chart, which I have inverted to highlight the ascend of the Japanese Yen:

You know what is happening here? R-E-P-A-T-R-I-A-T-I-O-N!!
Expect that trend not only to continue but to widen out over the coming months.
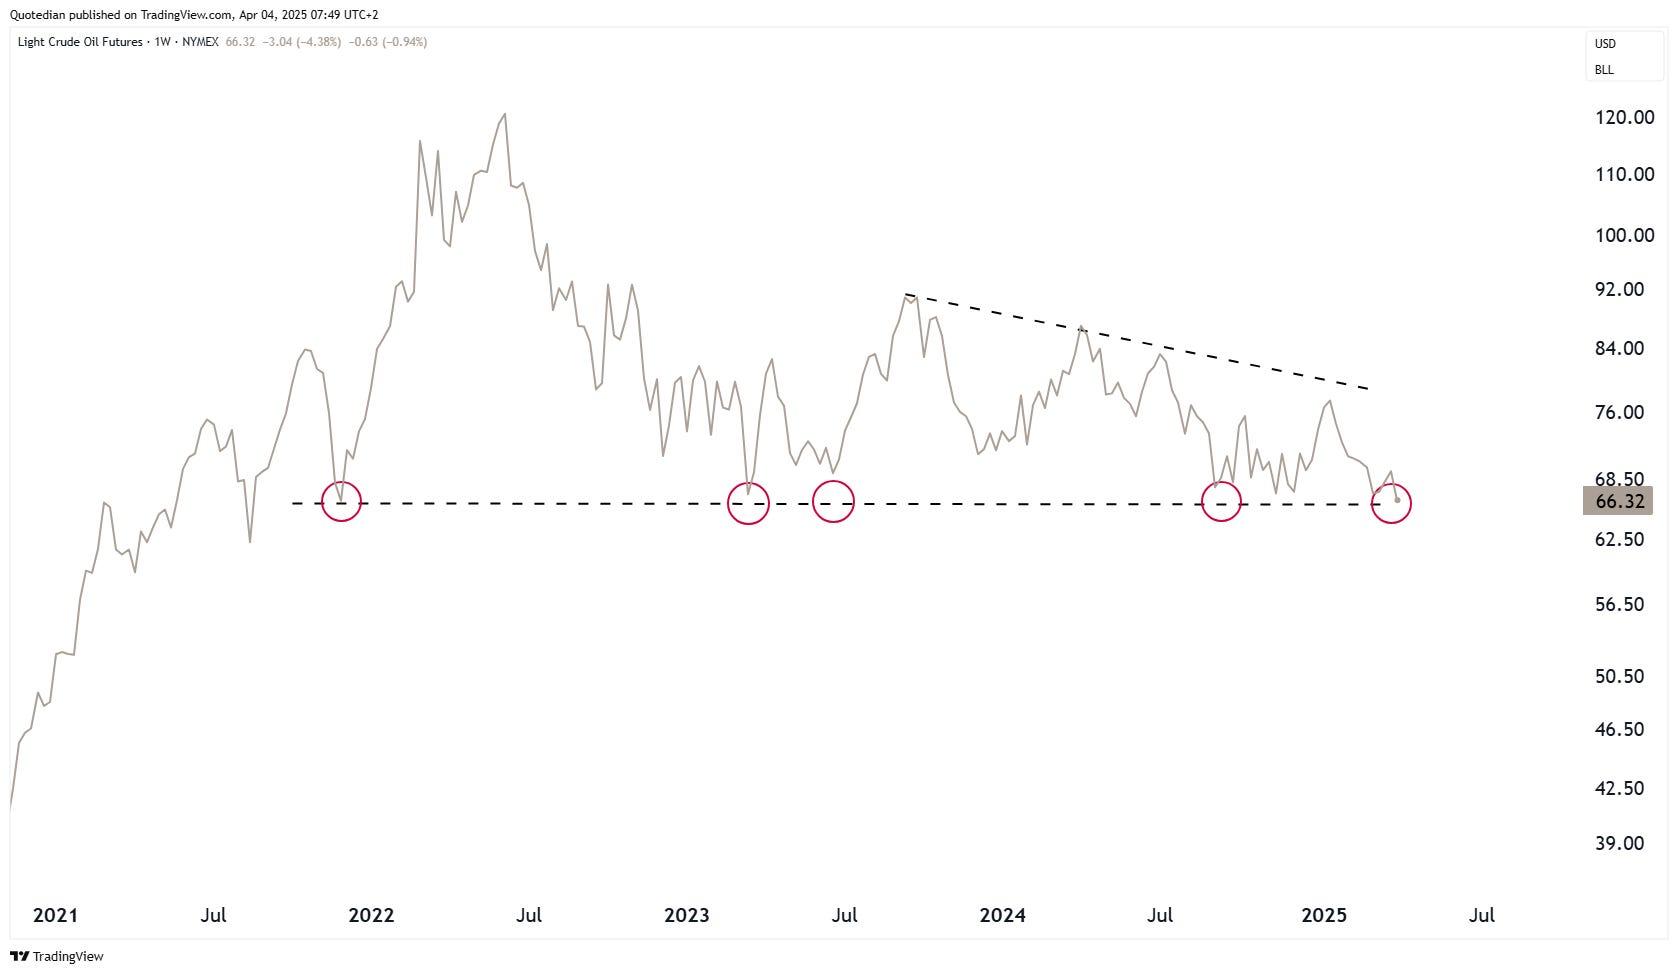
In the commodity space, oil got hammered by a) OPEC+ supply increase and b) tariff-induced decreased global trade:

For now, that ‘magical’ support at $65 on the WTI is holding:
Gold had a strange session yesterday - after having received a new ATH in the early hours, it had a sudden slump of roughly $80 in the afternoon, only to rebound sharply (black box):

My best guess here would be that someone overleveraged (maybe in equities) had to liquidate his entire portfolio …

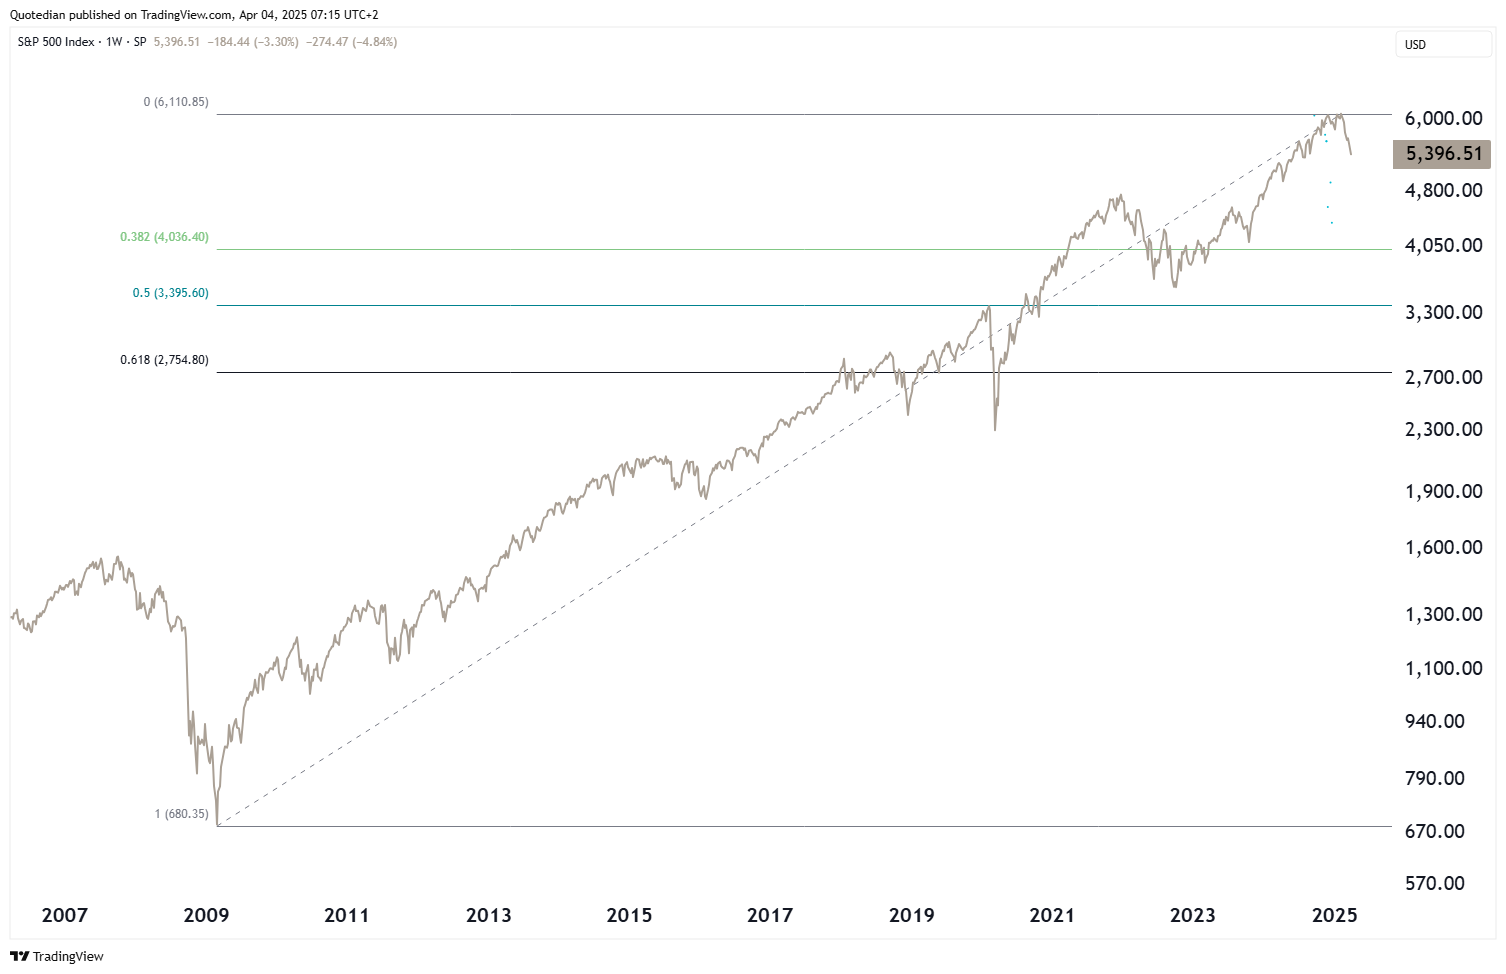
So, then, how much further can we drop on equity markets. Well, besides the theoretical bottom being at zero (just kidding - sort of), it is important to note that 4% drops or more do not happen often, but when they occur, they to do so in clusters and seldom at the bottom:

Within the context of the current bull cycle starting in late 2022, we haven’t even reached the first typical Fibonacci retracement level (38.2%) yet:

So my best guess is that we would/should visit the 5,160ish (-5%) to 4,860ish (-10%) level.
Unless, we have entered a secular bear market, for which given the news flow this week also a point can be made:
I let you figure out the implications of the chart above on your own. Ping me (ahuwiler@npb-bank.ch) or leave a comment in the comment section if you can’t:
Time's up, more next week - May the trend be with you!
