QuiCQ 14/03/2025
Gravity Check
"There's no fever like Gold fever."
— Richard Russell
Enjoying The QuiCQ but not yet signed up for The Quotedian? What are you waiting for?!!
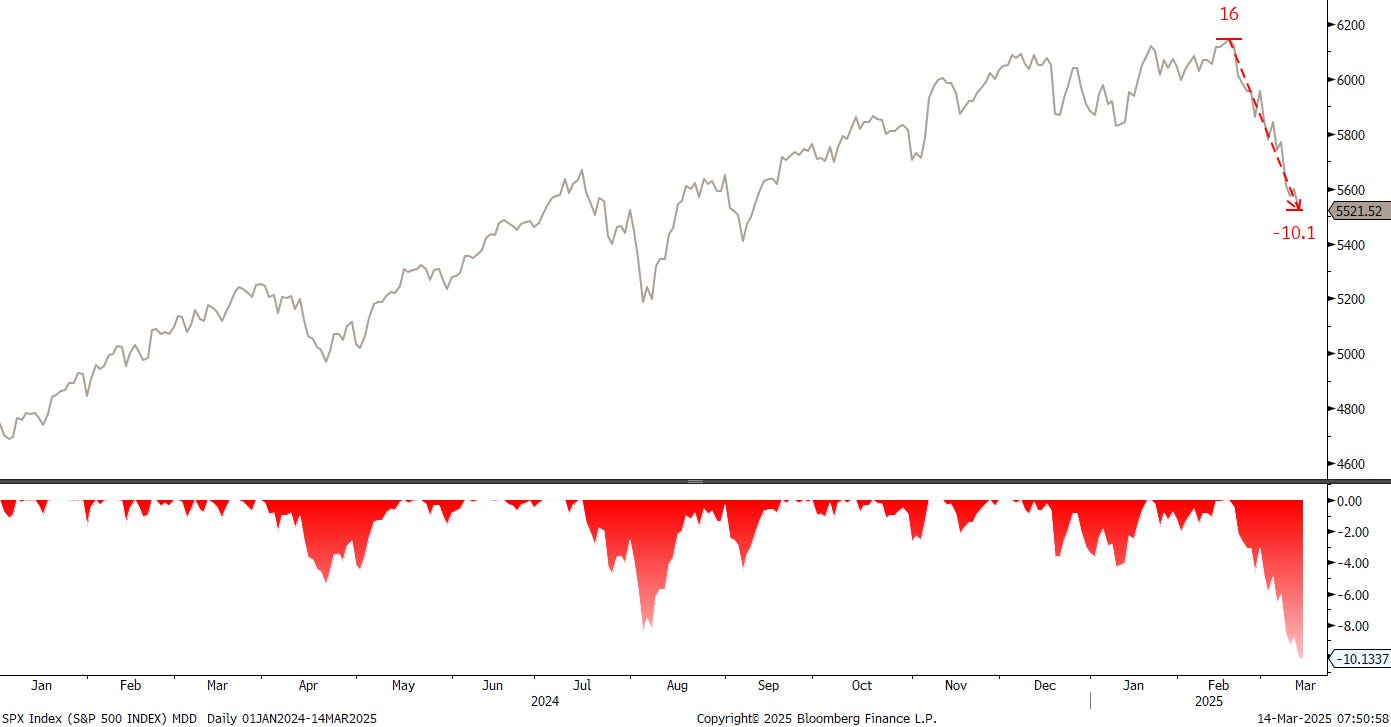
The S&P 500 closed down nearly one and a half percent yesterday, pushing the index firmly into correction territory, usually defined as a drop of 10% or more from recent highs:
This is the first 10%+ drawdown since the July to October 2023 correction, which by coincidence or not was exactly 10.2%, whereafter stocks headed nearly unabated toward the recent February high.
We have an interesting statistic of what happens to the market after a 10% correction, but to see that, you will have to subscribe to our other, also free, newsletter “The Quotedian” and wait until its next publishing date this coming Sunday/Monday:
Yesterday’s weakness did not come as a surprise to us QuiCQ readers, as we had analysed and classified the previous’ day relief rally as showing very weak internals.
Unsurprisingly, those internals did not improve yesterday, with nearly three stocks down on the session for every stock up and only one sector providing a green print:
The bloodbath continued in the what used to be known as the ‘TMT’ sectors.
During yesterday’s equity sell-off we can detect a certain flight to safety via bonds, where the entire US yield curve shifted lower (green) from the previous session (brown dotted):
The same seeking a safe haven pattern could be detected on currency markets, where the Japanese Yen, the US Dollar and the Swiss Franc in that order were the best performing currencies:
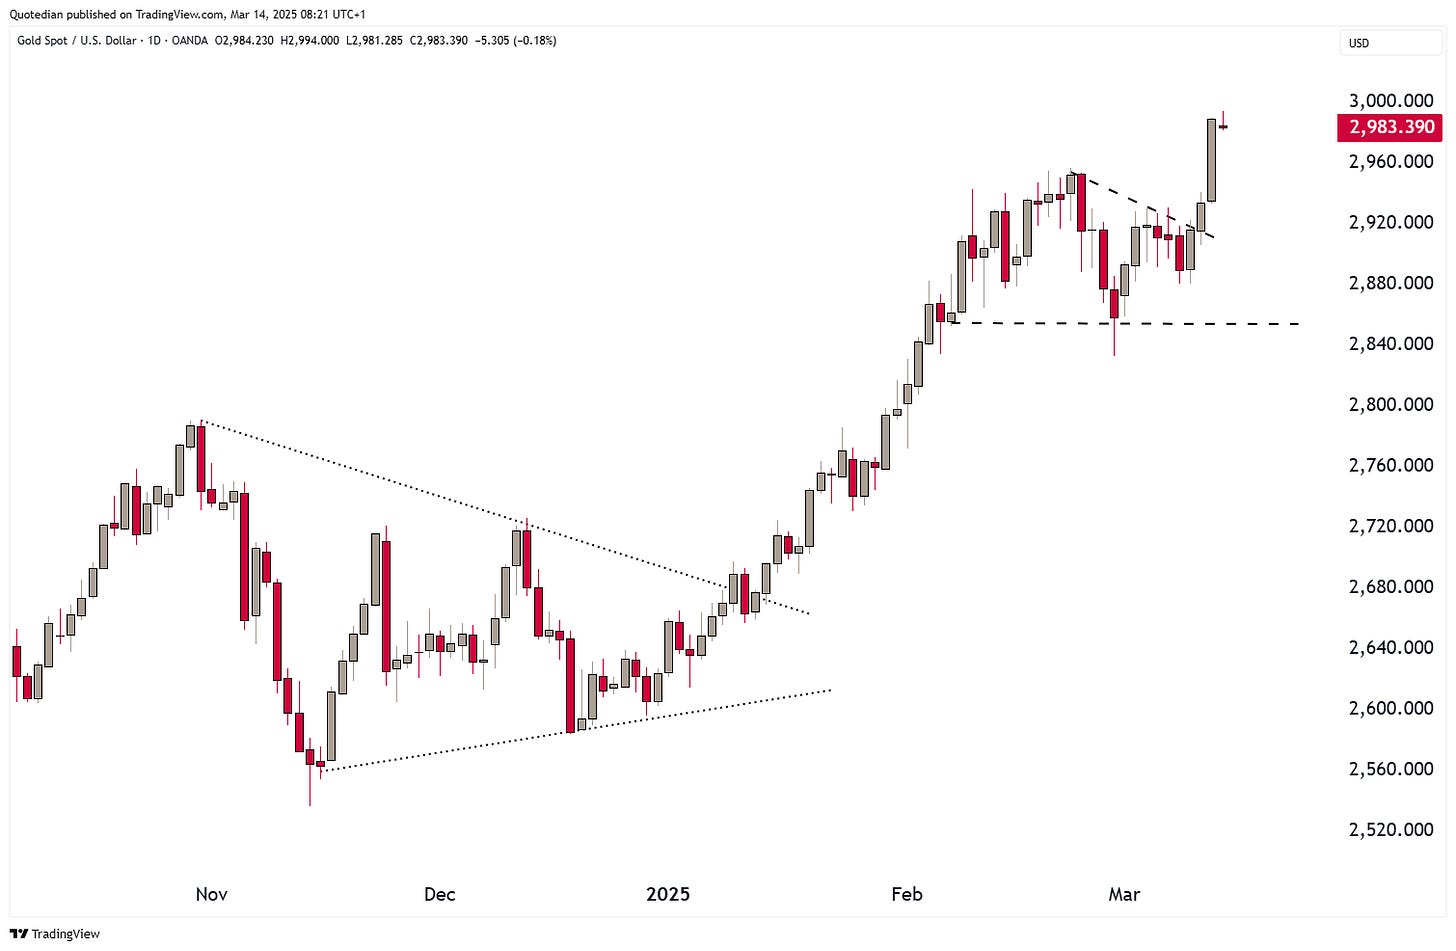
And then, finally, last but definitely not least, THE ultimate hiding place, namely Gold, nearly pierced the $3,000 level for a first time before retreating slightly by the time of my writing:
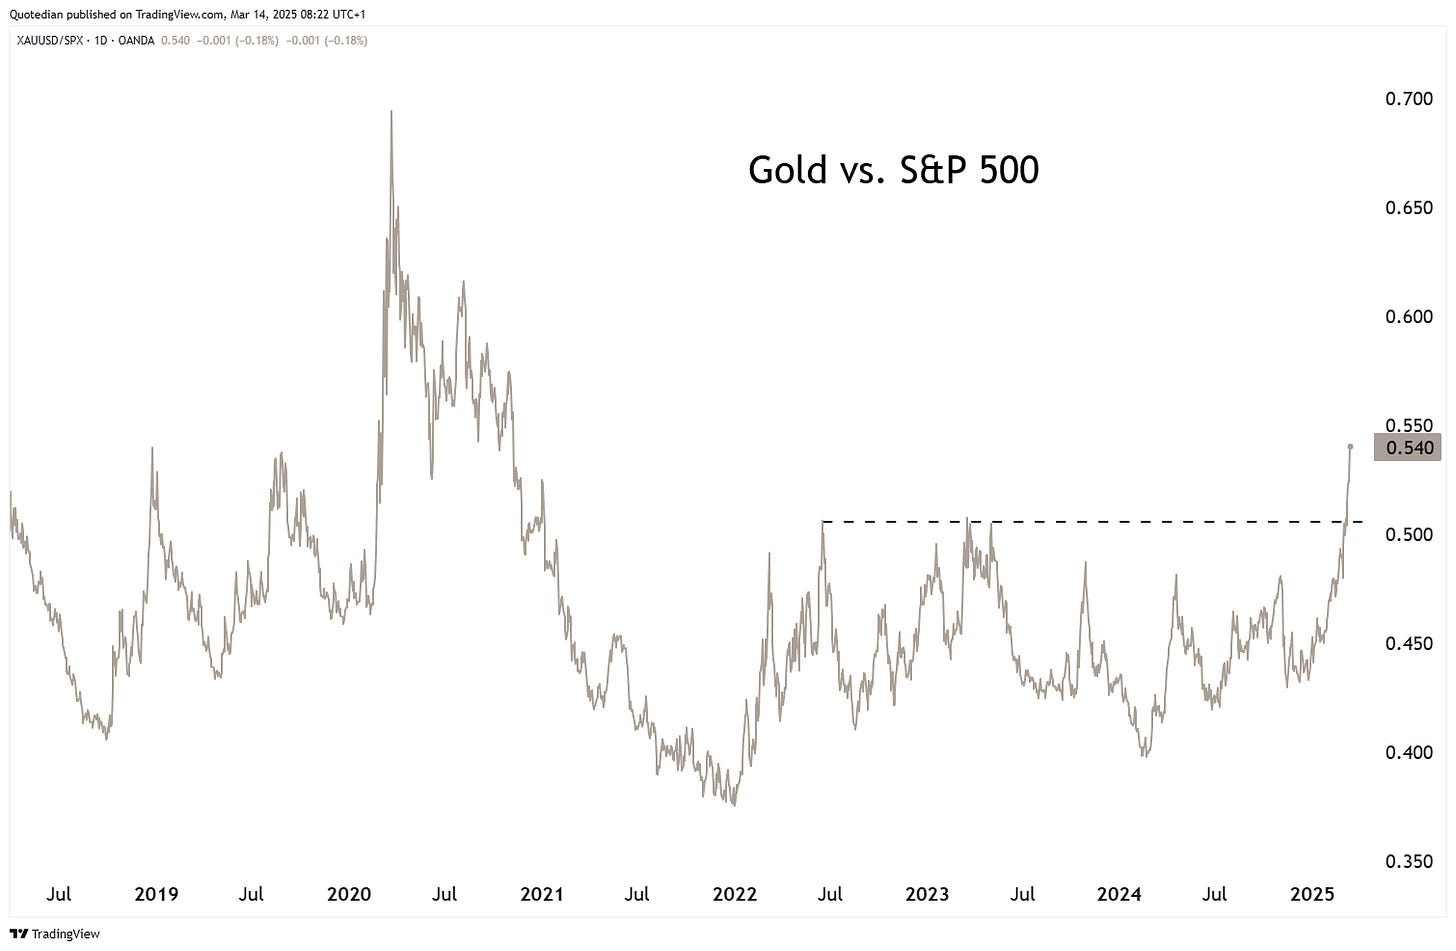
The yellow metal remains attractive on an absolute,
but especially also relative basis:
Time's up, more next week - May the trend be with you!
The fine folks at Goldman Sachs like to put together their tailor-made indices, which we have discussed in this past in the past also (e.g. HF VIP stocks, most shorted stocks, non-profitable tech, etc.).
Recently the added three new indices, based on the theme ‘Stagflation’. One is long stocks that would profit in a stagflationary environment, one that is short stocks that should suffer under the same conditions and a long/short version thereof, which is the red line in the chart below.
Comparing that Stagflationary Long/Short Basket (red) to the S&P 500 (grey) since the beginning of the year, reveals a 25% performance difference, suggesting that the market is indeed positioning for Stagflation:
Stay tuned …


