QuiCQ 14/11/2025
Bumpy


“Fundamentalists who say they are not going to pay any attention to the charts are like a doctor who says he’s not going to take a patient’s temperature.”
— Bruce Kovner
Enjoying The QuiCQ but not yet signed up for The Quotedian? What are you waiting for?!!


(US) Stocks took a bit more than a breather Thursday, as the Nasdaq saw a third two percent drop in the past three weeks, whilst the S&P 500 faced its largest sell-off in a month:

The following chart on the Nasdaq-100 shows that we have arrived at a crucial make-or-break point for tech stocks:

The index is standing at the juncture of key support from the trend channel (red shaded) in place since the Liberation Day sell-off and the 50-day moving (greenish line) which served as bouncing level over the past few months. Should stocks head lower from here, we also would face first lower high, a further indication of trend change.
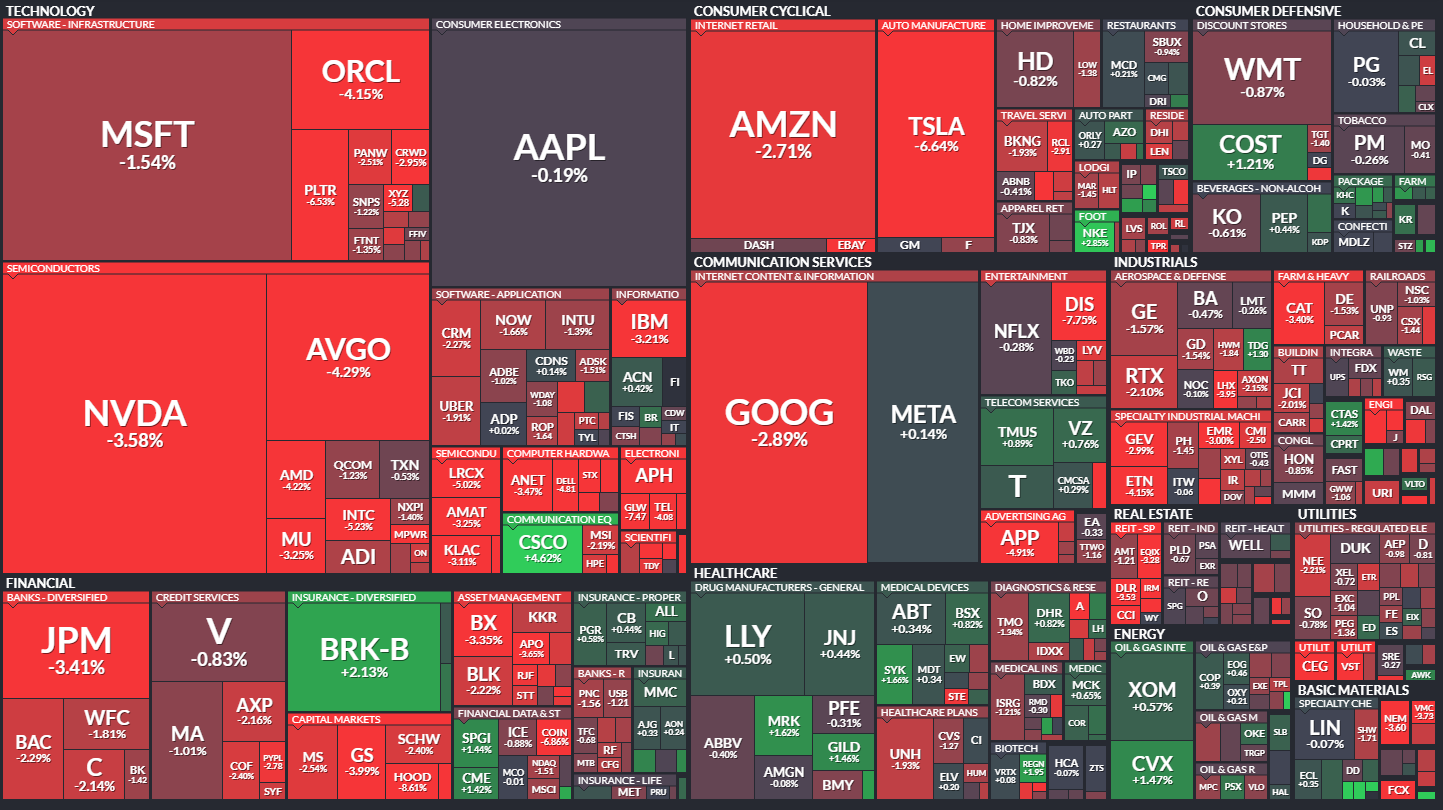
Looking at our new dashboard above (bottom left) we also note that breadth was heavily negatively skewed, with decliners outpacing advances by four to one. Accordingly, the S&P 500’s heatmap was a sea of red yesterday:
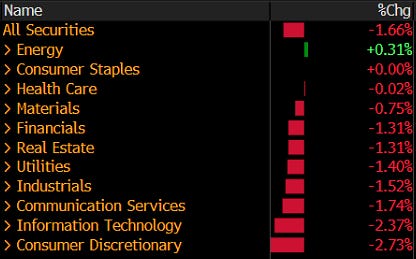
Only energy stocks were able to eke out a gain:
Staying on energy stocks for a moment, I find following chart, which by a very narrow margin did not make it to the “Chart-of-the-Day” hall of fame, very interesting:

It shows in the lower clip the oil refining stocks, as measured by the VanEck Oil Refiner ETF (CRAK - bottom clip), just made a new all-time high (ATH). Will this be enough to lift integrated oil stocks, proxied via the SPDR Energy ETF (XLE - top clip) out of their triangle consolidation formation? I think yes.
Given the size of yesterday’s equity sell-off, one would have expected a certain flow of monies into bonds. However, yields actually advanced yesterday as the chart of the US 10-year Treasury shows:

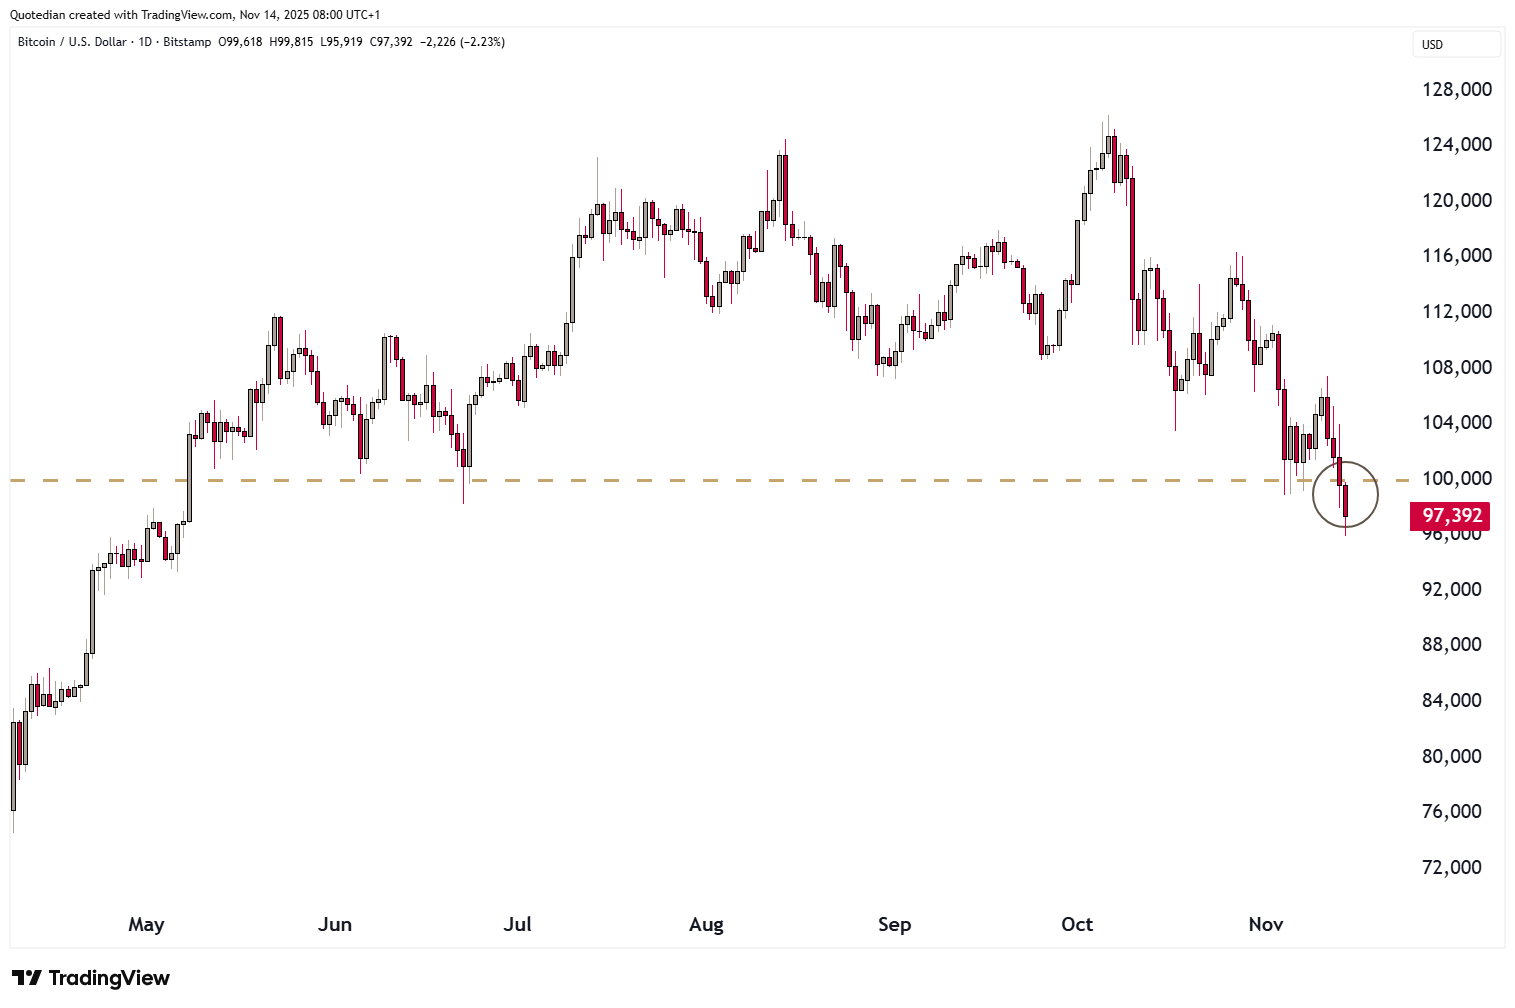
Little movement in FIAT currency markets, though CRYPTOS are worth a look at, especially Bitcoin. A view QuiCQ’s ago I mentioned that a decisive break below 100k in Bitcoin could imply a price target of 80k to 75k. Well…
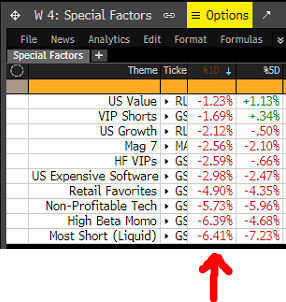
Quickly back to equity markets, just before we sign off. Our table of ‘special factors’ shows that the frothiest parts of the market are being strongly sold (and probably rightfully so):
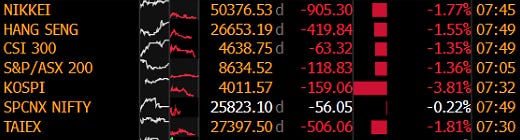
Unsurprisingly, the sell-off is continuing in Asia for now,
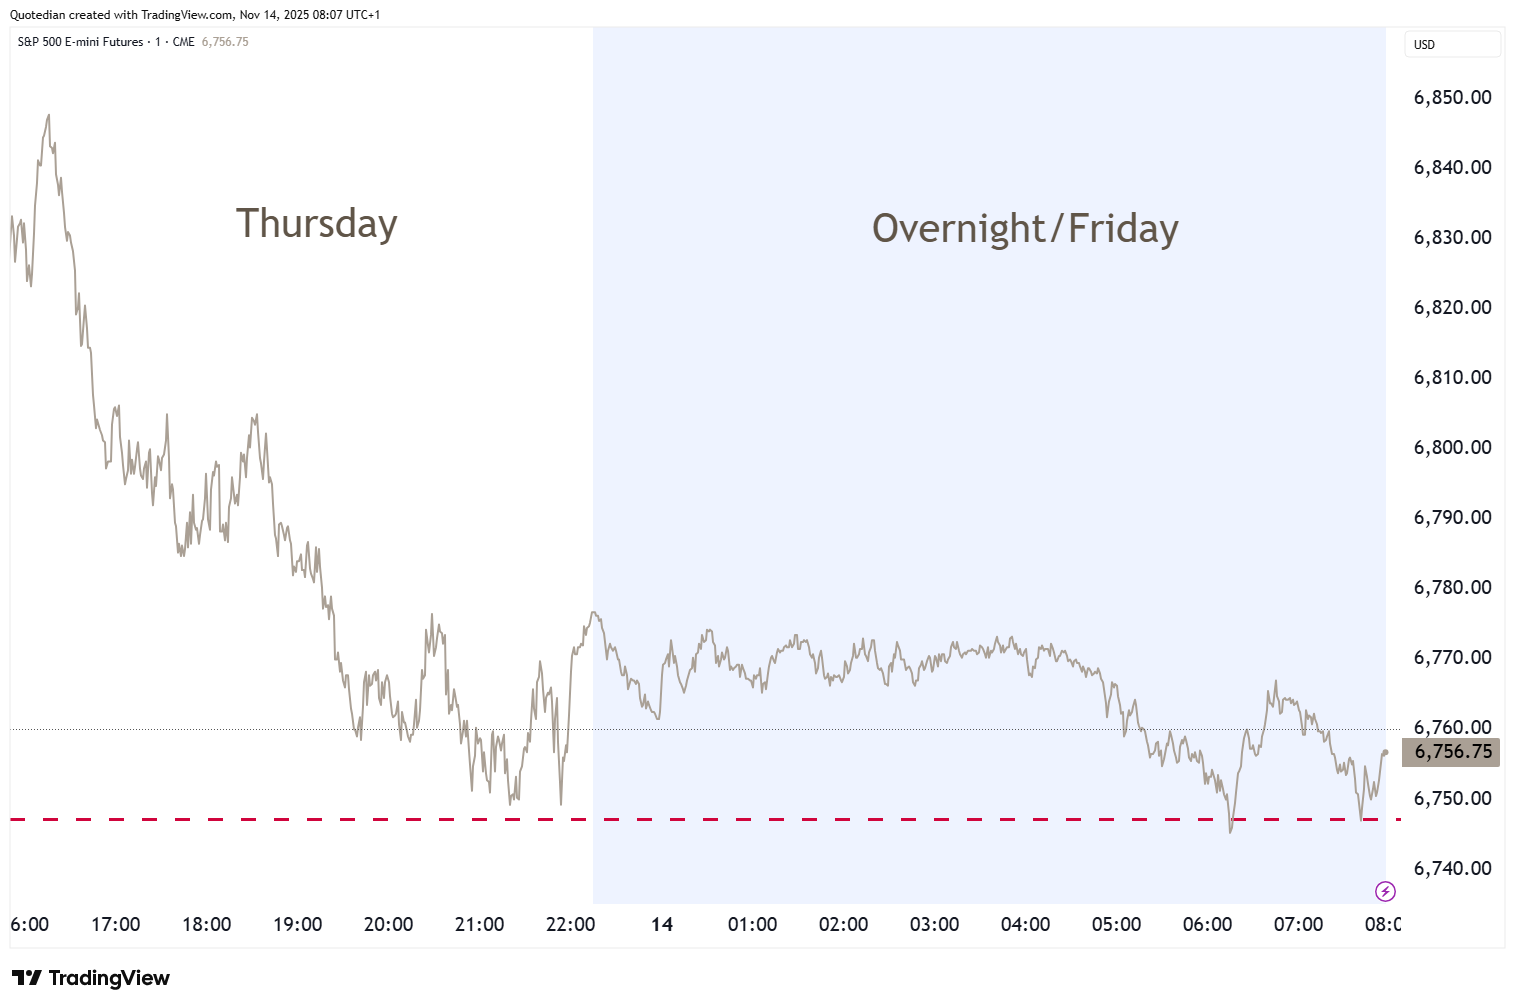
though US index futures (S&P 500 mini) are trying to put in a bottom to the sell-off:
Have a great weekend!
André

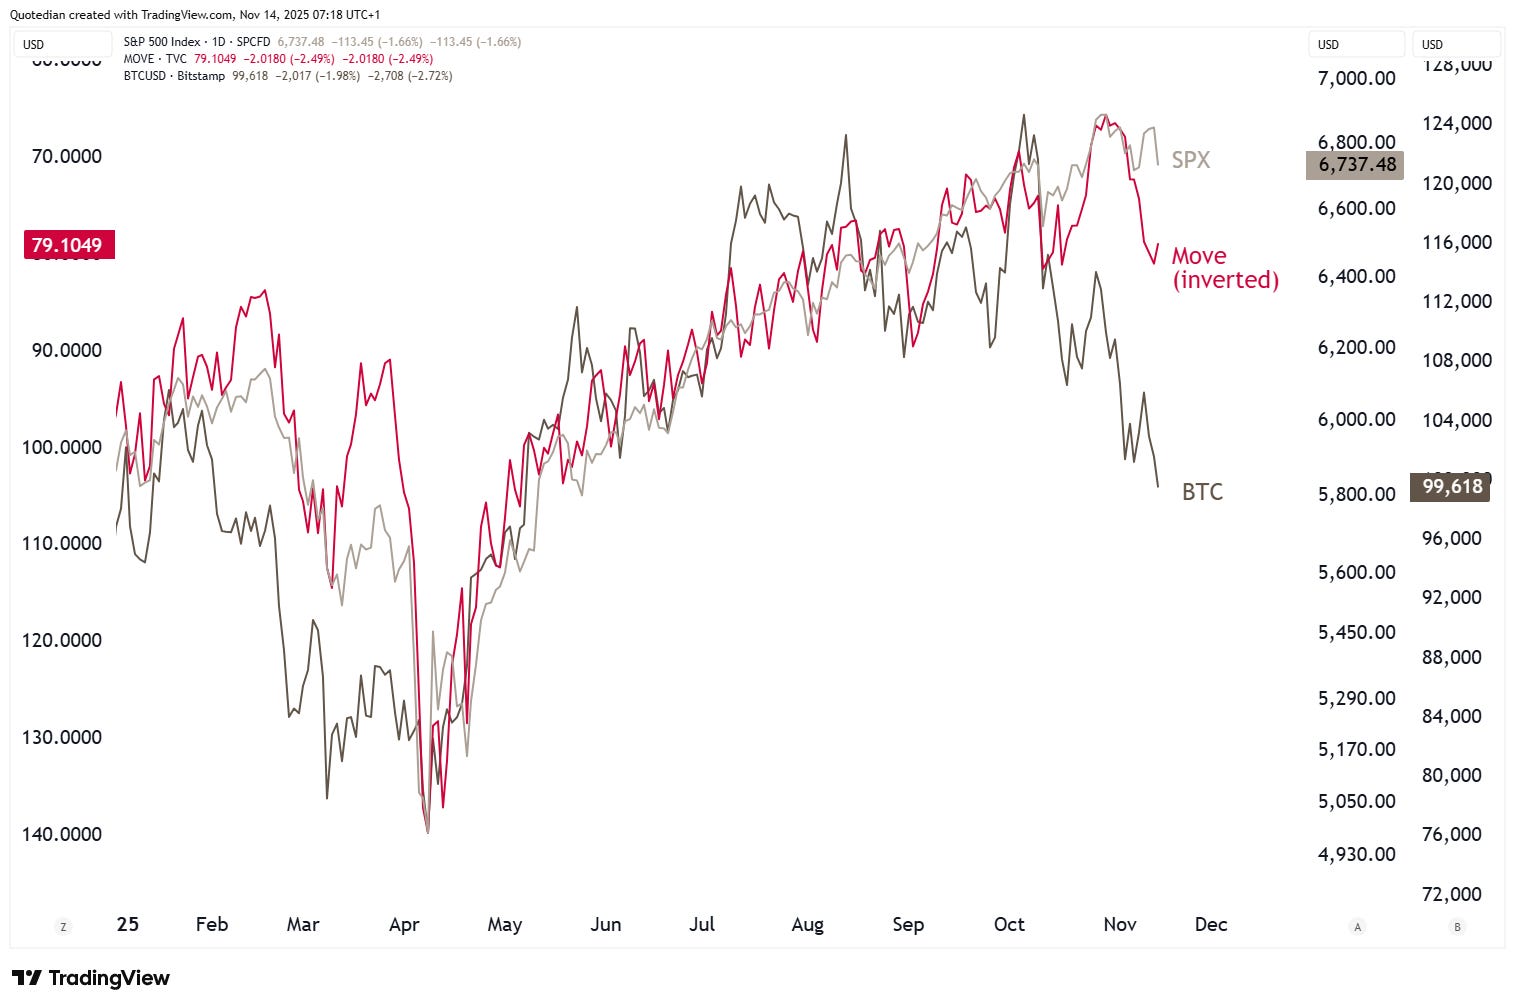
Over the past 12 months, stocks (SPX - dark grey), inverted bond volatility (MOVE - red) and Bitcoin (XBT - grey) have been moving in tandem, which intuitively makes a lot of sense. Bitcoin can be considered a liquidity proxy, i.e. increasing liquidity good for stocks. Simultaneously, lower bond volatility equals market calm and is probably also beneficial for stocks.
The problem? Both, MOVE and XBT have been diverging from the SPX since late and early October respectively. Just a short-term deviation or an omen? Was yesterday’s sell-off a first step in direction of ‘normalization’?
Stay tuned …