

The Q - Daily Edition - 11/06/2026
Peacefire
"I can calculate the motion of the heavenly bodies, but not the madness of men."
— Isaac Newton

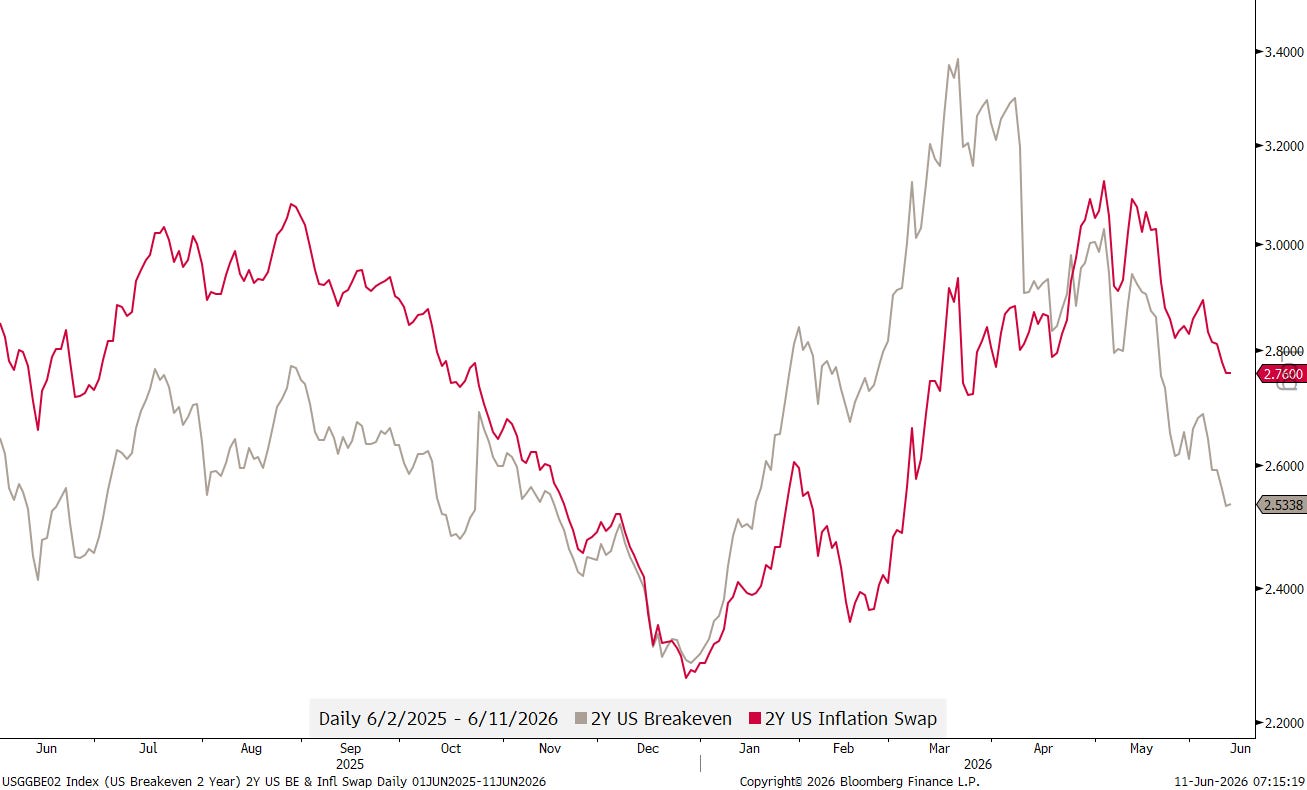
US inflation numbers were published yesterday, and despite the headline number (4.2%) moving above that ominous four percent, markets were pretty relaxed about it. Here are the 2-year US Breakeven (grey) and the 2-year US Inflation Swap (red) as examples of relaxation:
Is that “laissez-faire” approach to the inflation number then justified? Well, sure, a big component of the increase was energy prices, which arguably is well baked into the investors’ collective consciousness, and, of course, are the prospects of the Iran/US conflict ending (ehemm) bright … realistic … possible … feasible not zero. Nevertheless, energy was not the only contributor to that elevated inflation number, but so was services and that stubborn food price inflation is not going away either:
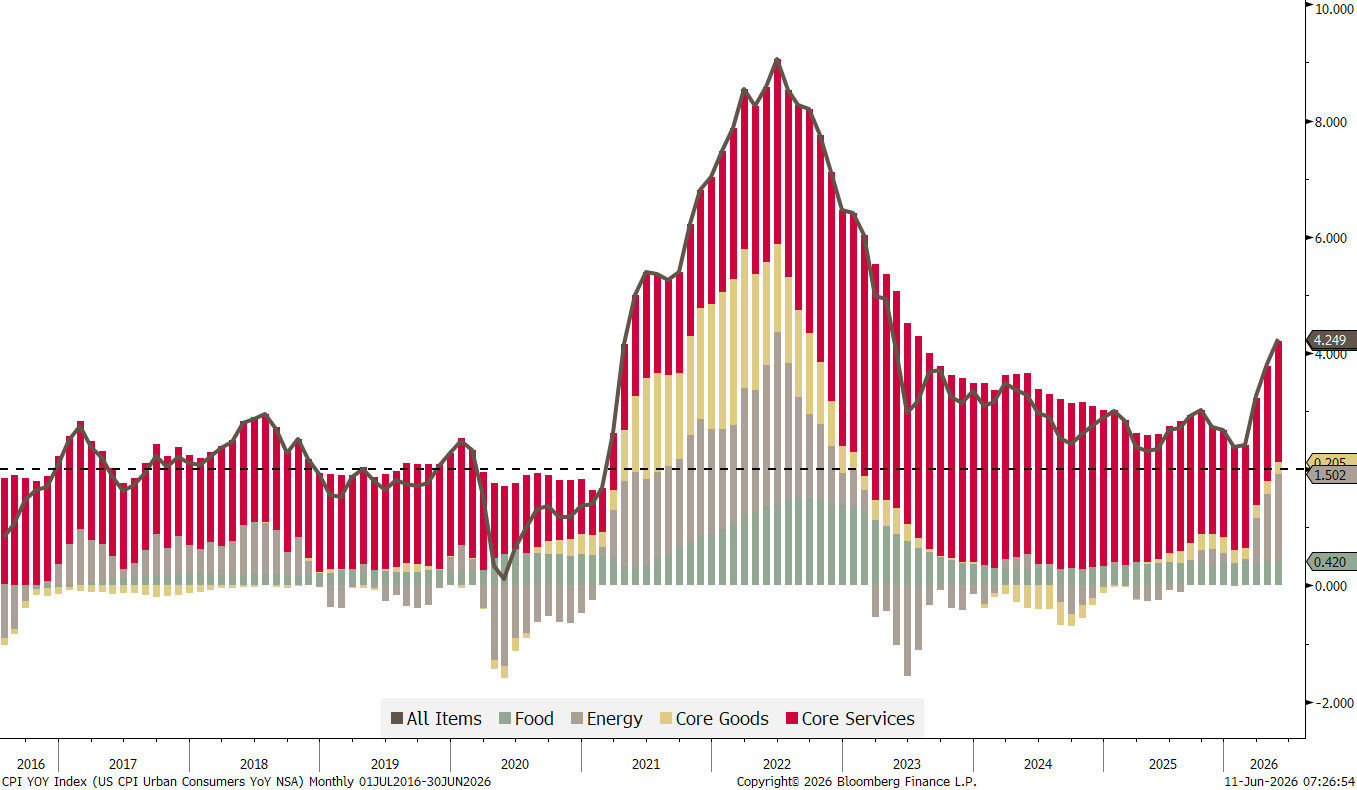
By the way, that black, dashed line in the chart above is a cheeky reminder of what the Fed’s inflation target is … it is beating that by more than double 🫣
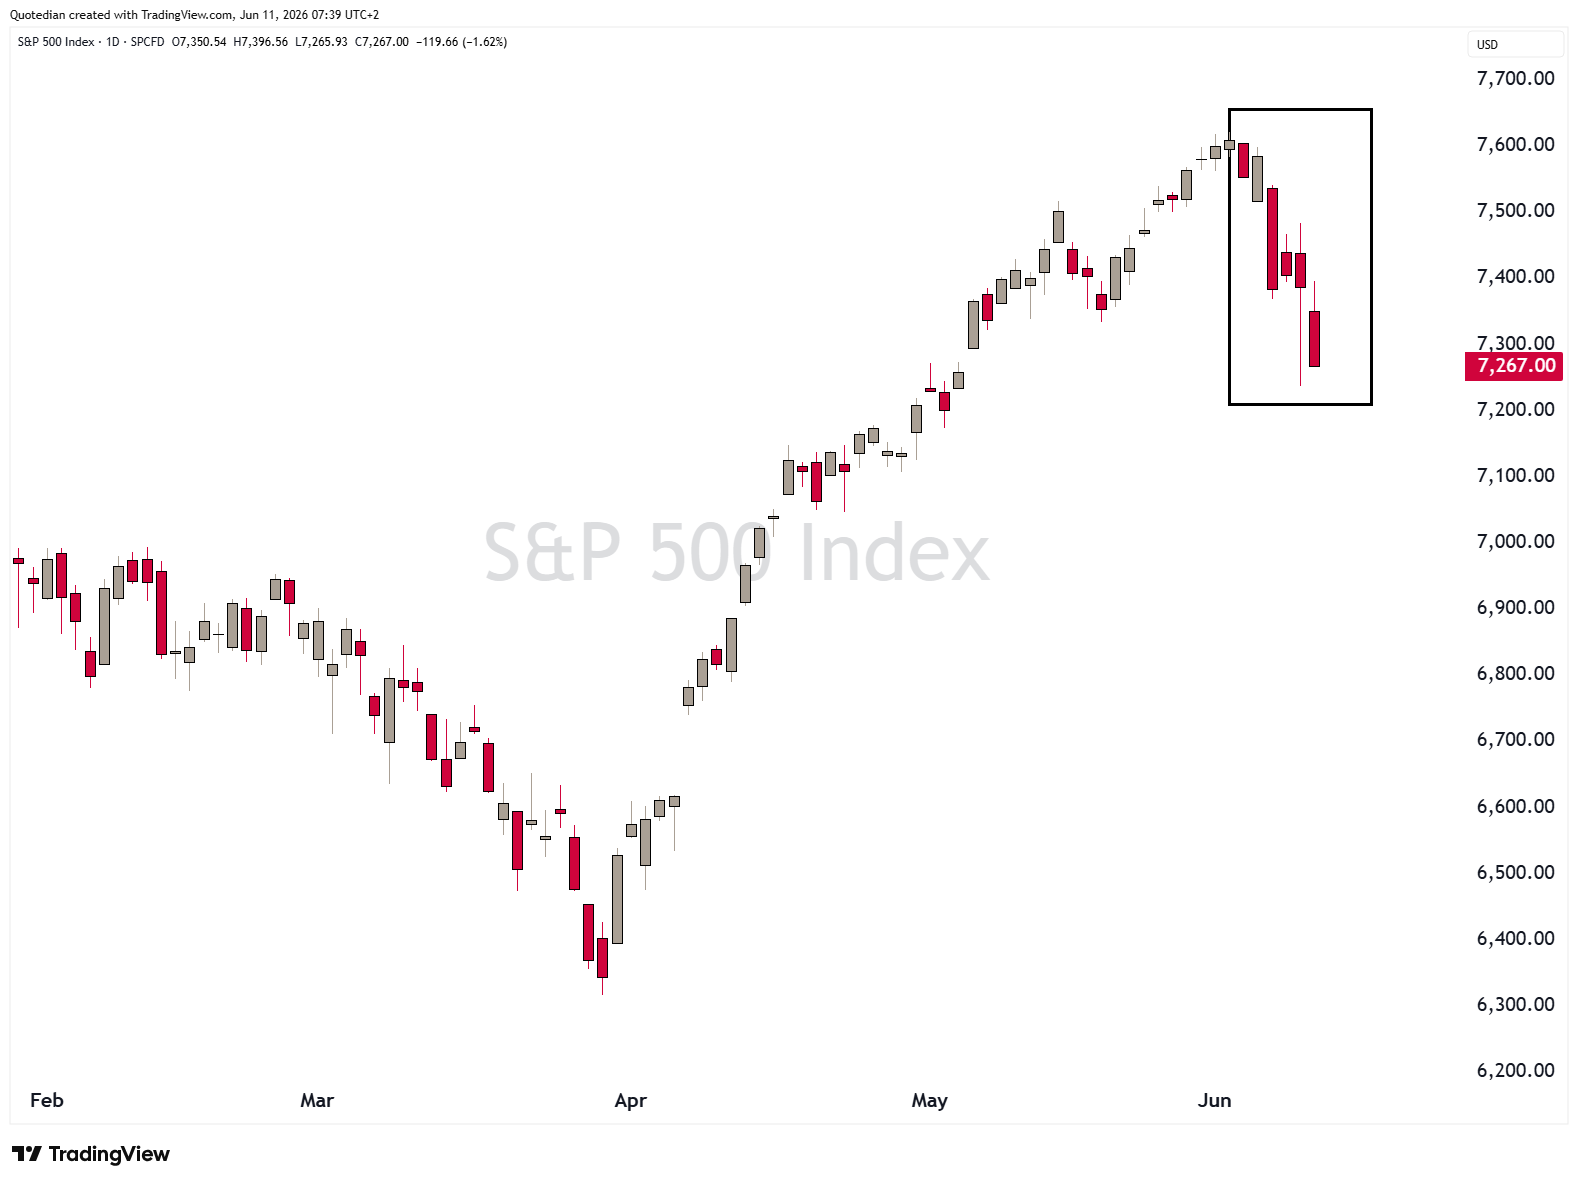
A glance at equity markets shows that they decided to sell-off once again yesterday, but probably less “high CPI number, hence, higher tighter monetary policy ahead”, but rather, on the back of resurgence of kinetic warfare action in the Middle East. Here’s the chart of the S&P 500 mini-futures over the past hours:
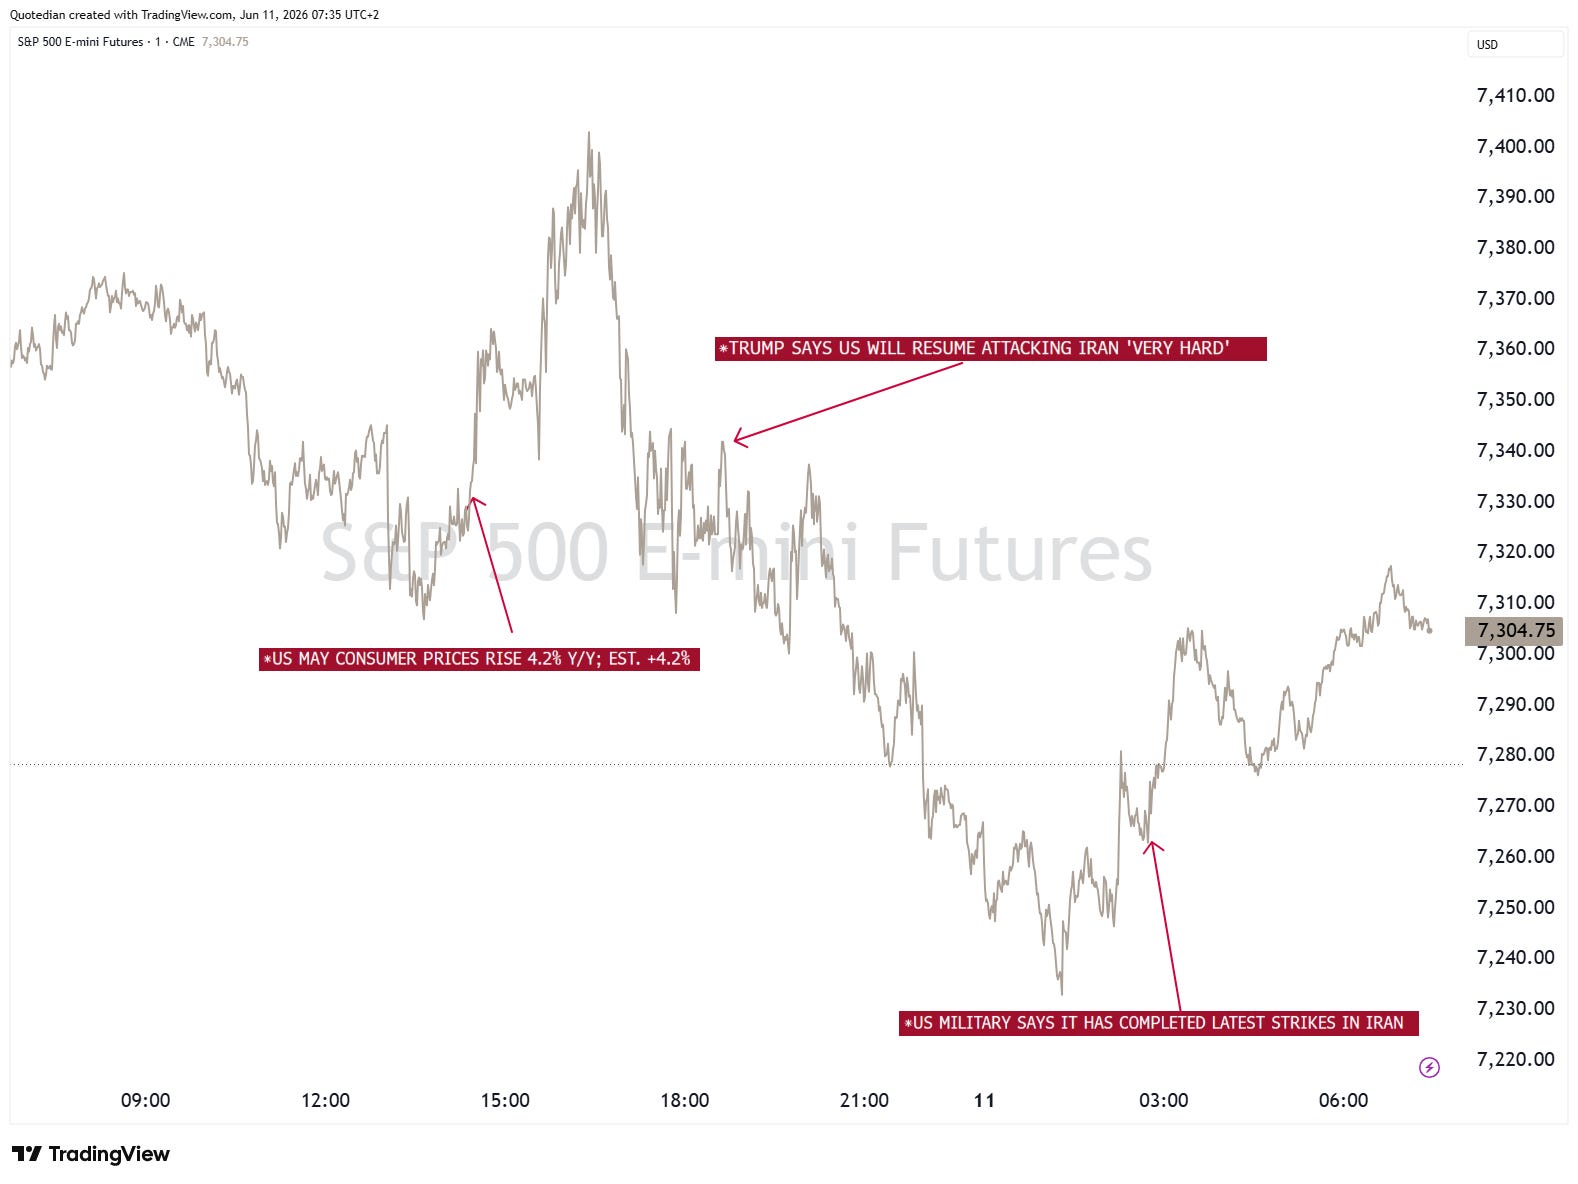
There you go! Don’t they say a picture is worth more than a thousand words?
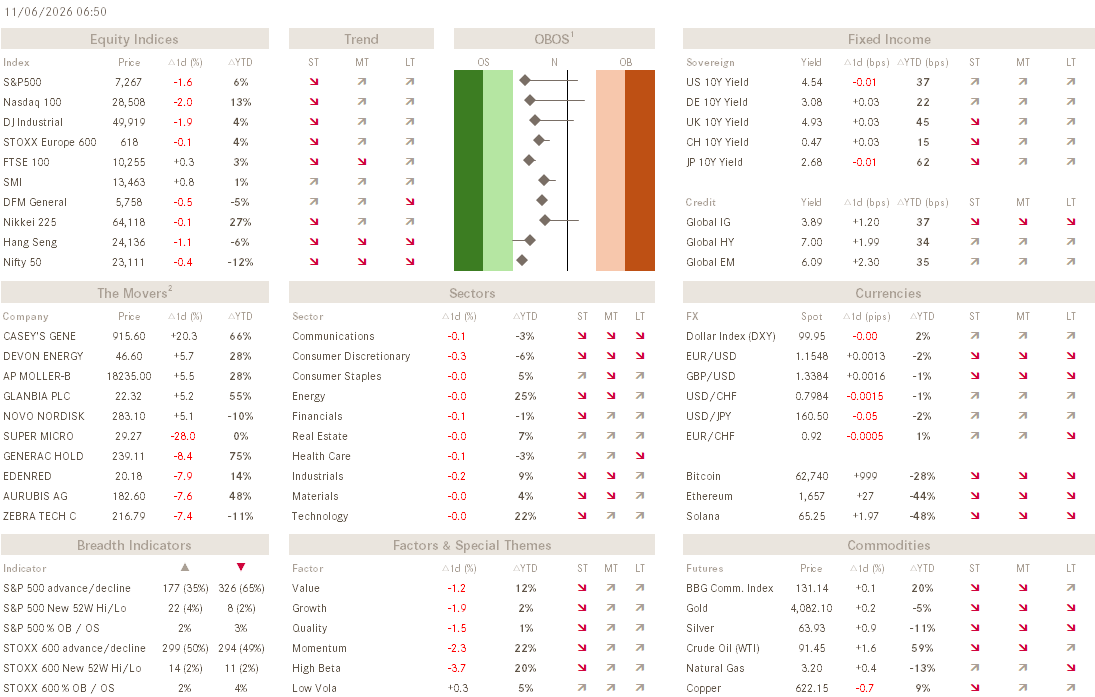
What is not shown on this picture, nor evident if you only look at the top left of our dashboard above,
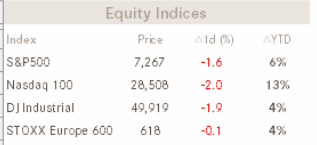
is that under the hood, which is depicted in the bottom left of the dashboard,
“things” actually continue to look pretty constructive.
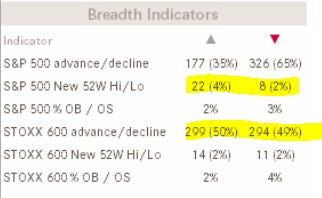
None of those massive sell-offs over the past week or so,
has shown any massive capitulation. Quite “au contraire”, during some of the darkest hours, either more stocks were rising than falling, or like yesterday in the US for example (see above), more stocks hit a new 52-week high than a new 52-week low.
Now, two things can happen from here:
The “rest of the market” is strong enough to counterbalance the sell-off in those large-cap, momentum-driven stocks, and eventually moves higher again.
The sell-off, which started in those market-cap-heavyweights, spreads to the rest of the markets and starts dragging everything else down.
For now, I am giving those scenarios a 65% (1) weighting and a 35% (2) weighting, respectively…
Looking at other asset classes, we can of course expect the movement in oil prices over the past hours to be the mirror image of equity prices:
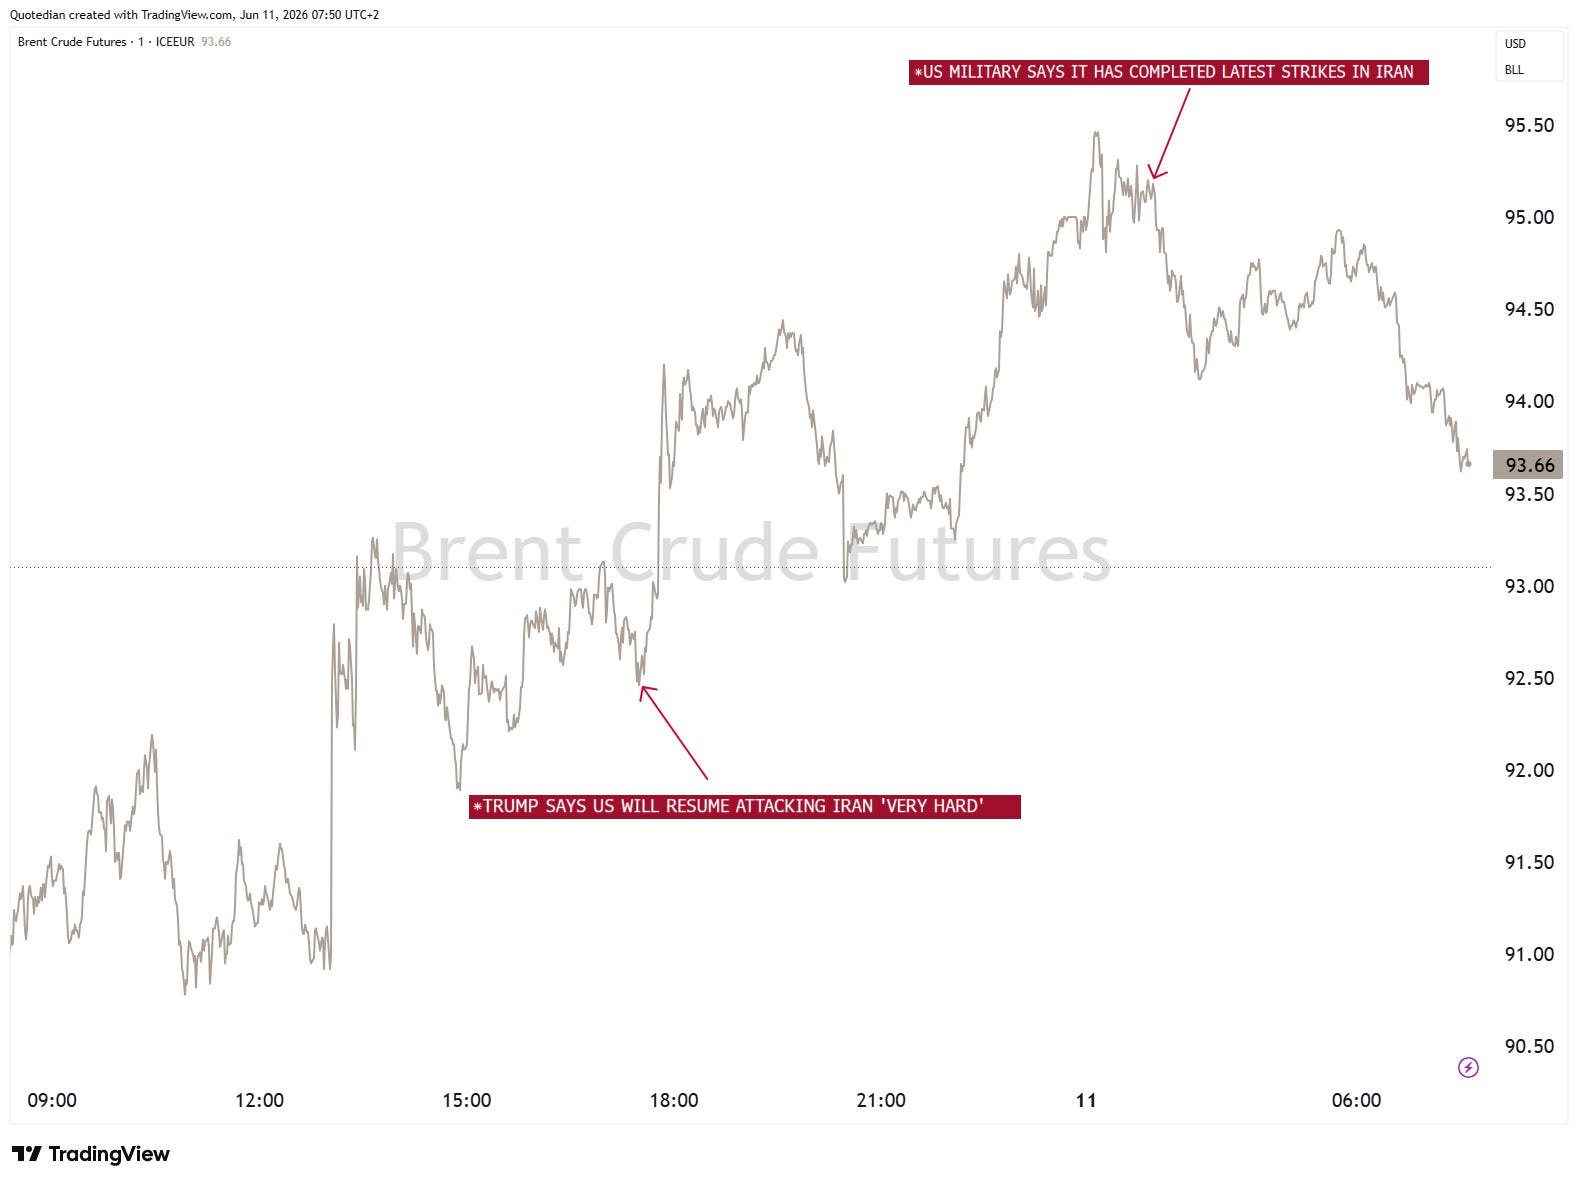
Indeed.
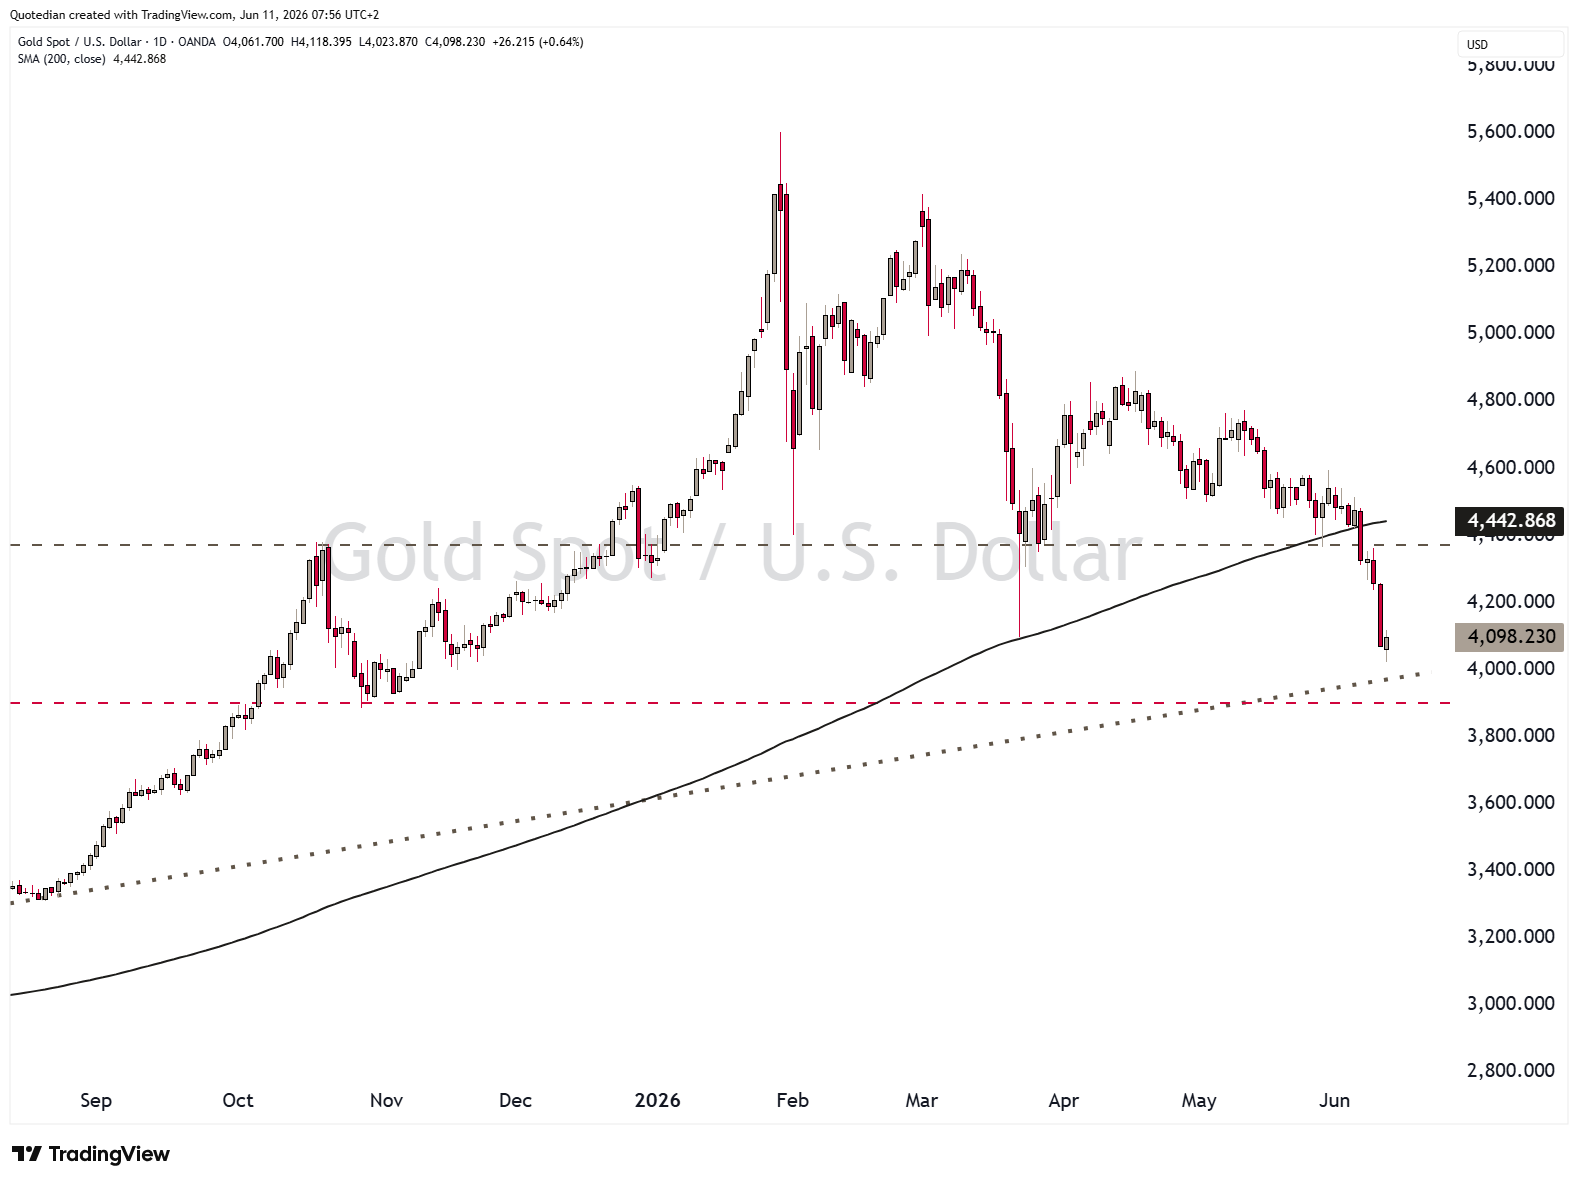
Another cross-asset class we briefly need to talk about is Gold, on which we already had a bearish chat yesterday (and over the several past weeks now). For us here on the Investment Committee at NPB, the price action in the yellow metal has now been negative enough to reduce our exposure even further, by exiting the position for the time being alltogether. I will be writing a detailed note about the decision later today and post a link to it in tomorrow’s Daily Quotedian (aka QuiCQ). So, make sure to STAY TUNED!

So, here we are, Thursday June 11th, where the largest ever IPO will get priced (starts trading tomorrow). We already expressed my opinion regarding buying into a stock priced at a price/sales ratio of nearly 100x, so no need to repeat my disgusts.
Hence, I leave you just with this infograph,
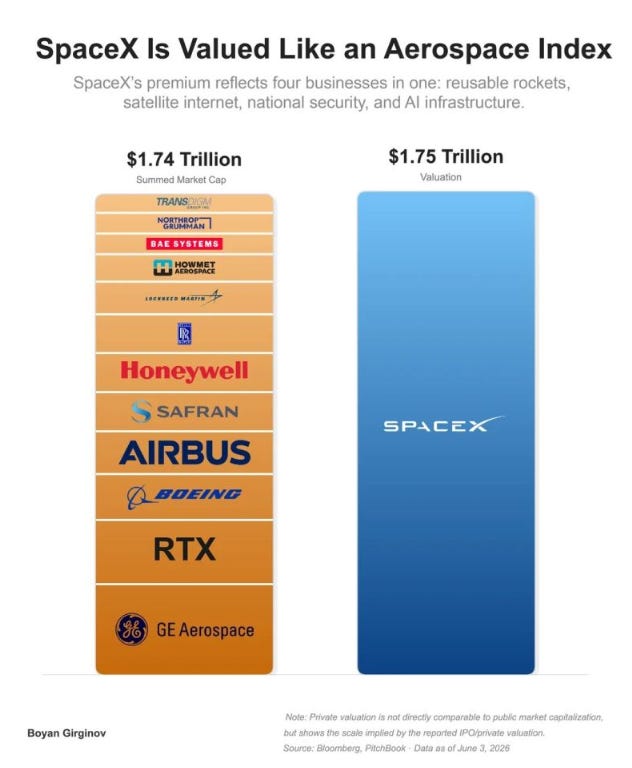
and the observation that we should be watching like a hawk whether these IPOs make money for PUBLIC MARKET investors vs treating them as “Exit Liquidity” for the PRIVATE MARKETS.
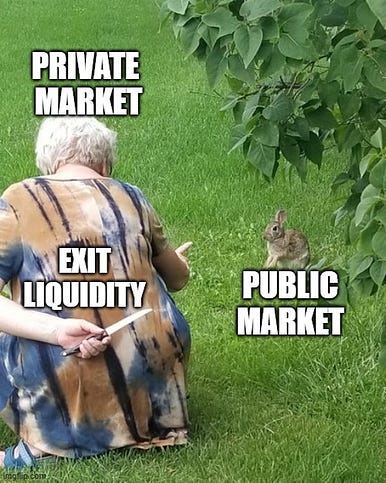
Unfortunately, I know the answer already.

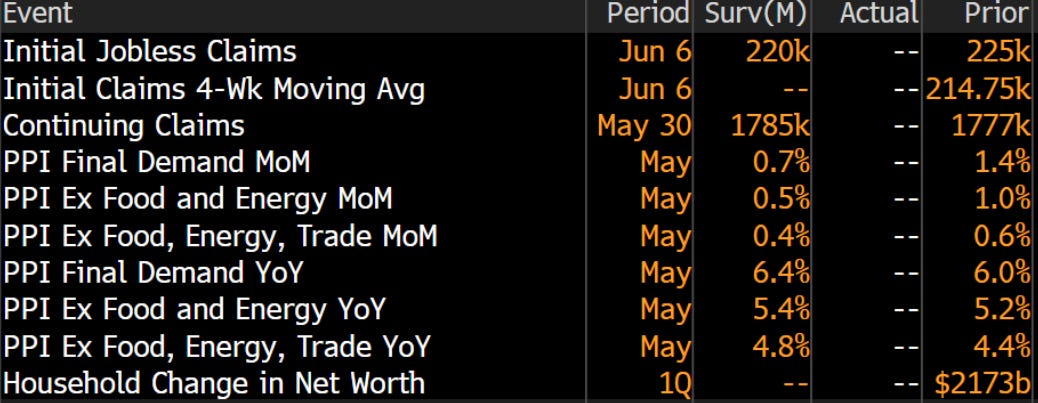
Do not ignore today’s US PPI number:
André


Everything in this document is for educational purposes only (FEPO)
Nothing in this document should be considered investment advice
Investing real money can be costly; don’t do stupid shit
Leave politics at the door—markets don’t care.
Past performance is hopefully no indication of future performance
The views expressed in this document may differ from the views published by NPB Neue Privat Bank AG