

“It ain’t what you don’t know that gets you into trouble. It’s what you know for sure that just ain’t so.”
— Often attributed to Mark Twain

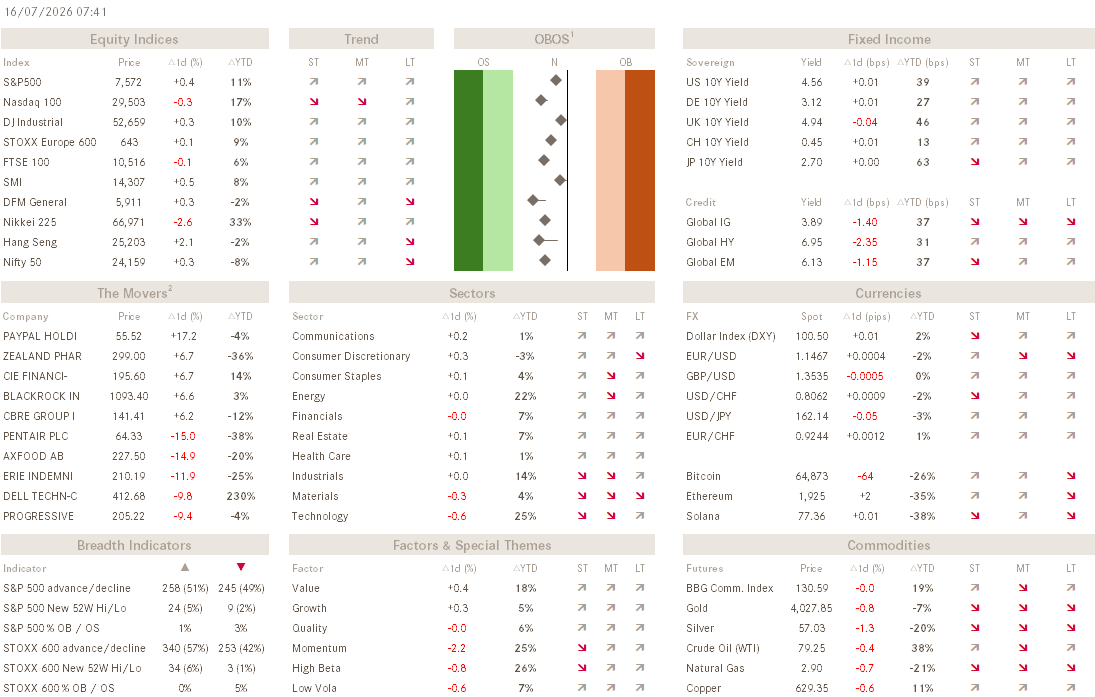


Just a brief update today, reinforced by a small apology for the radio silence over the past two weeks, which has been a very busy period for yours truly, preparing our quarterly investment outlook, which now was published yesterday and which you can find here:
In our outlook we take about “Rotation, Rotation, Rotation” and how we expect equity markets to slowly switch from the high momentum/growth corners into higher quality (tbd) stocks.
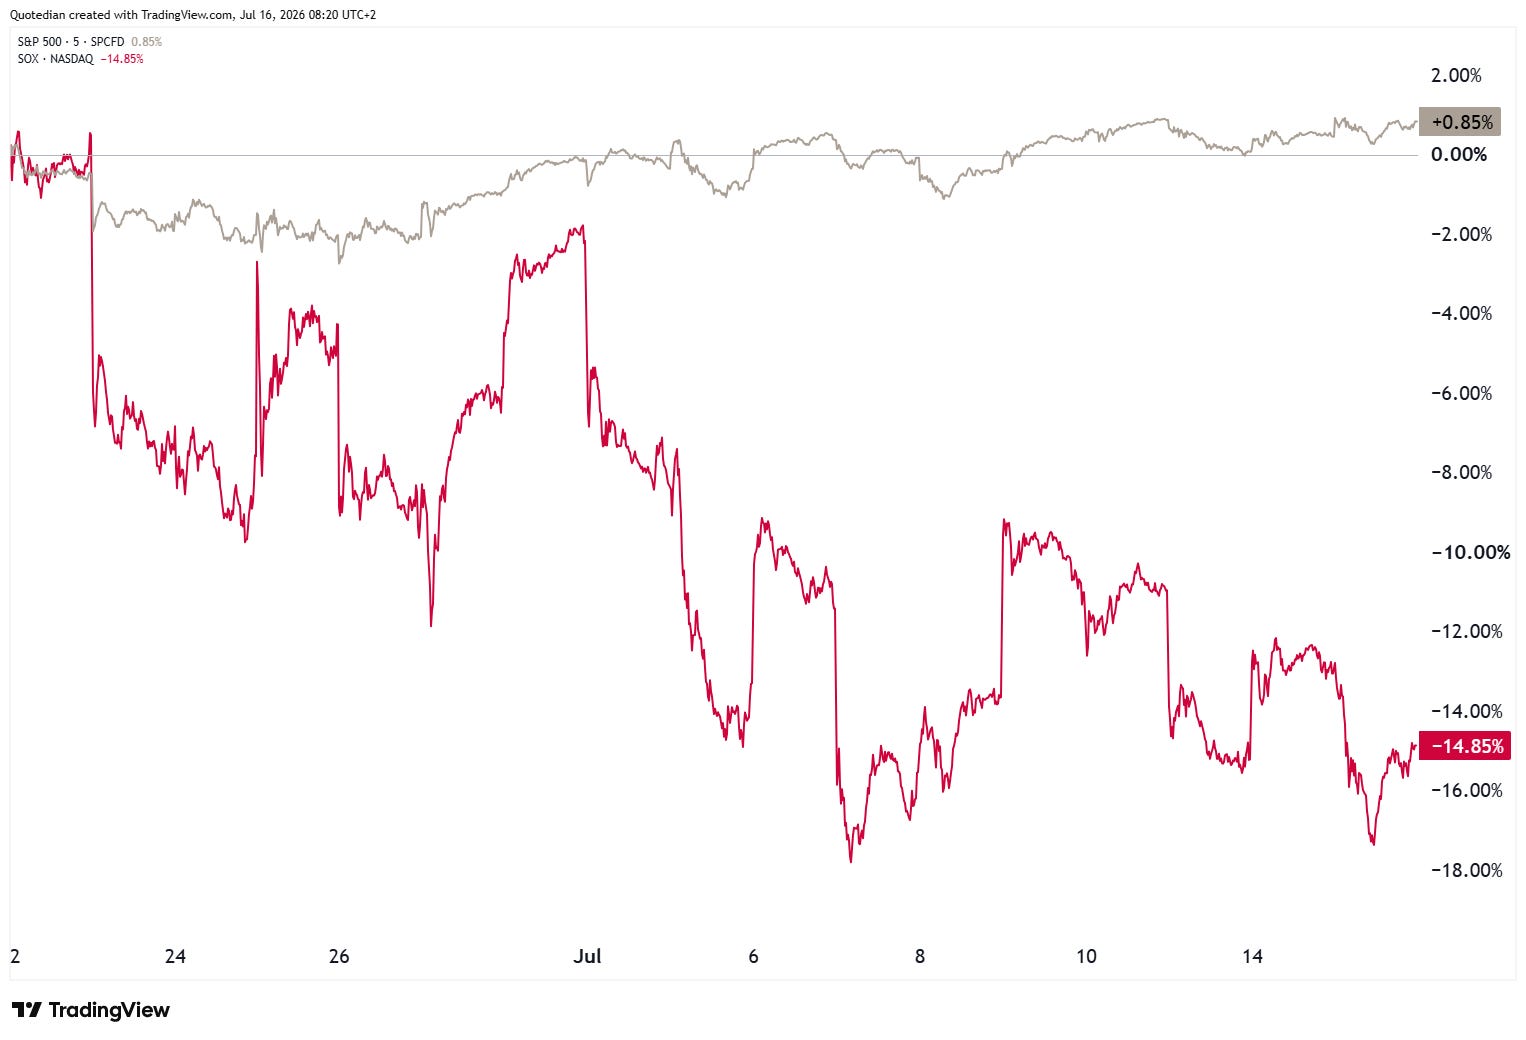
One expression of this concept was to be well observed yesterday, with the Philadelphia Semiconductor index down around 2% on the session, whilst the S&P 500 close up about 40 basis points.
That divorce between the indices has become now very apparent over the past three weeks:
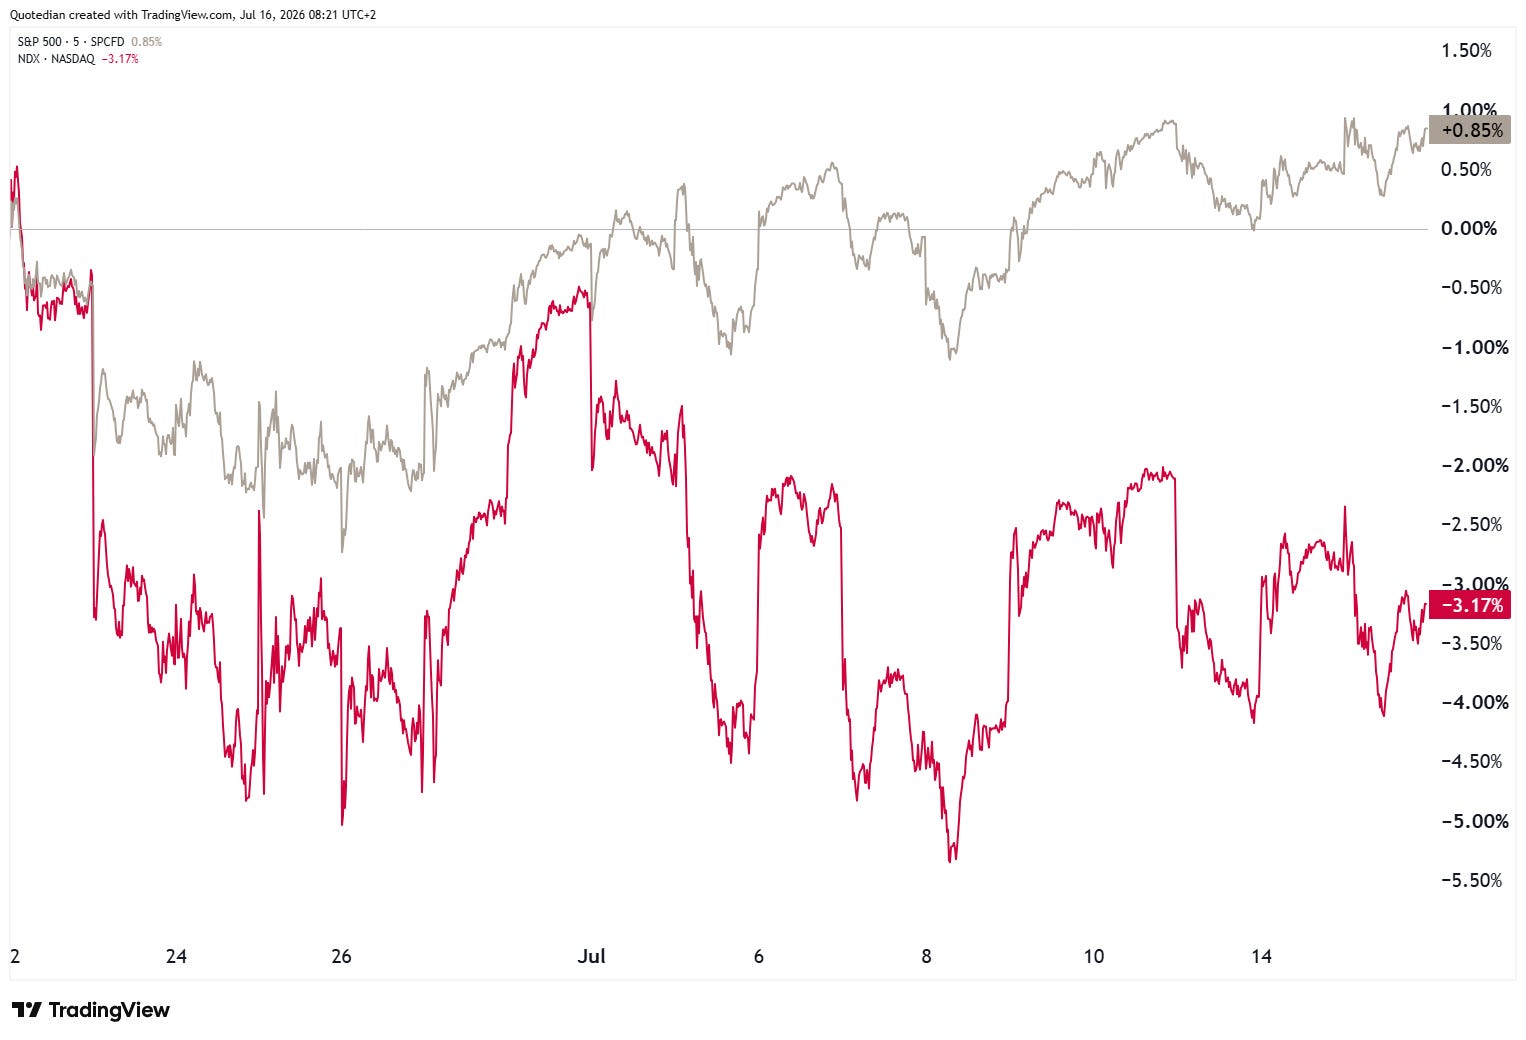
This then is of course also true for the S&P 500 - Nasdaq spread:
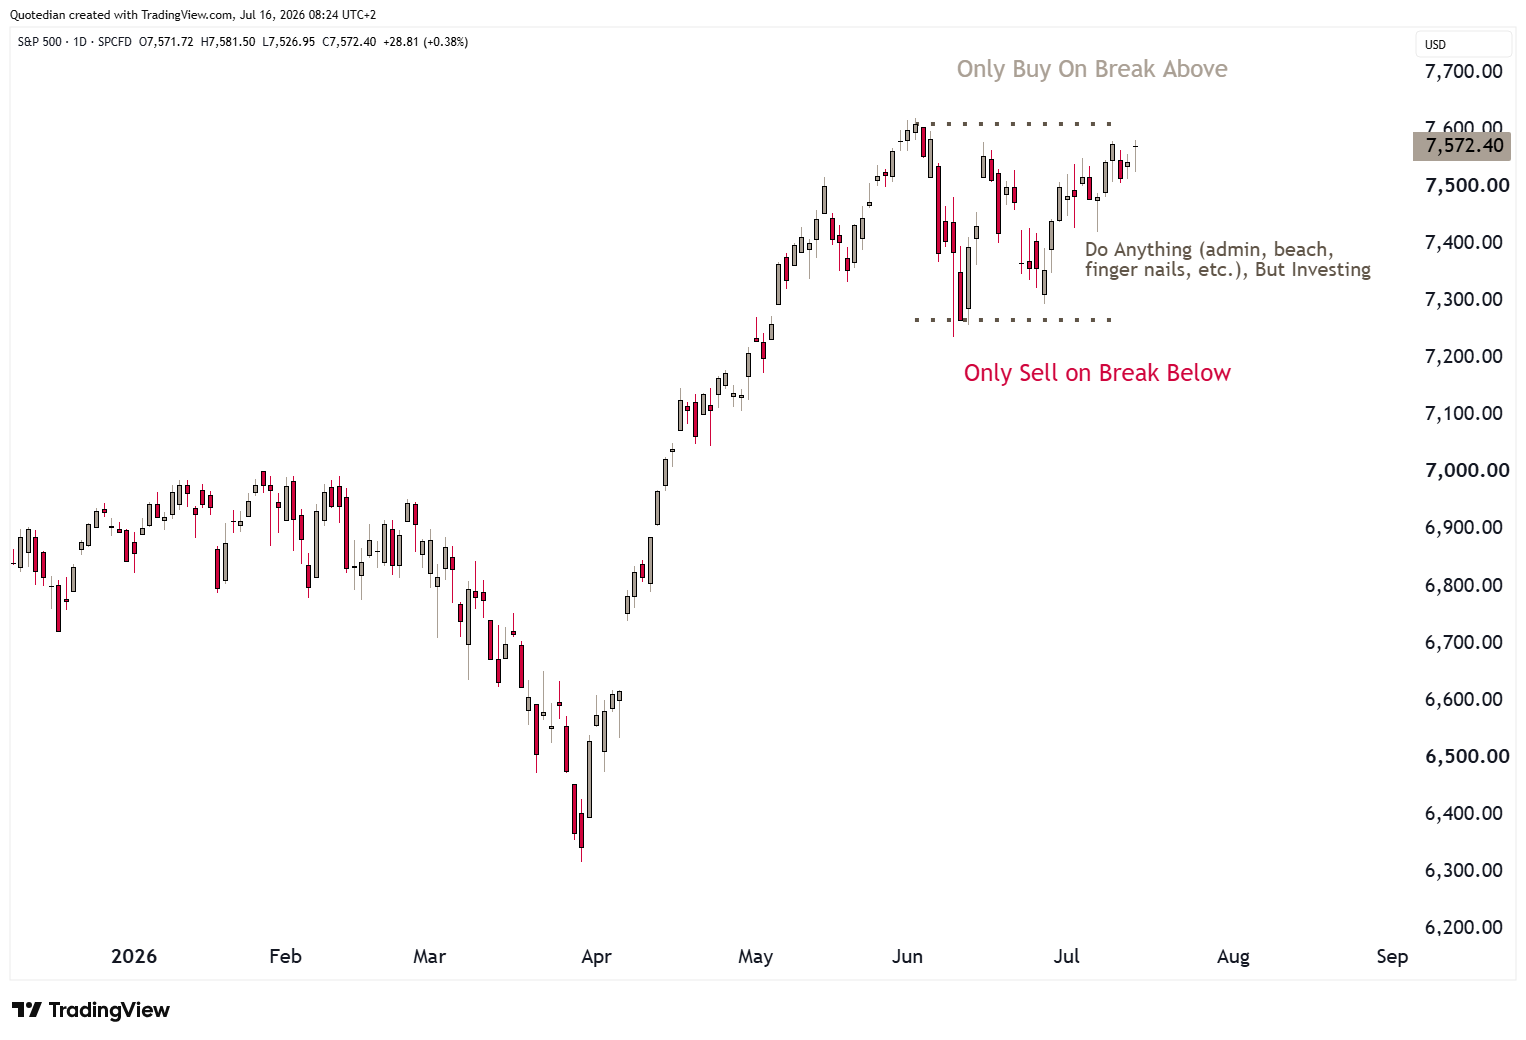
Hence, we get two pretty different longer term impressions on each of those. The S&P 500 continue to move within our lines in the sand, don’t do anything range, but with a breakout higher seemingly imminent:
Whilst the Nasdaq leaves us a much less constructive image:
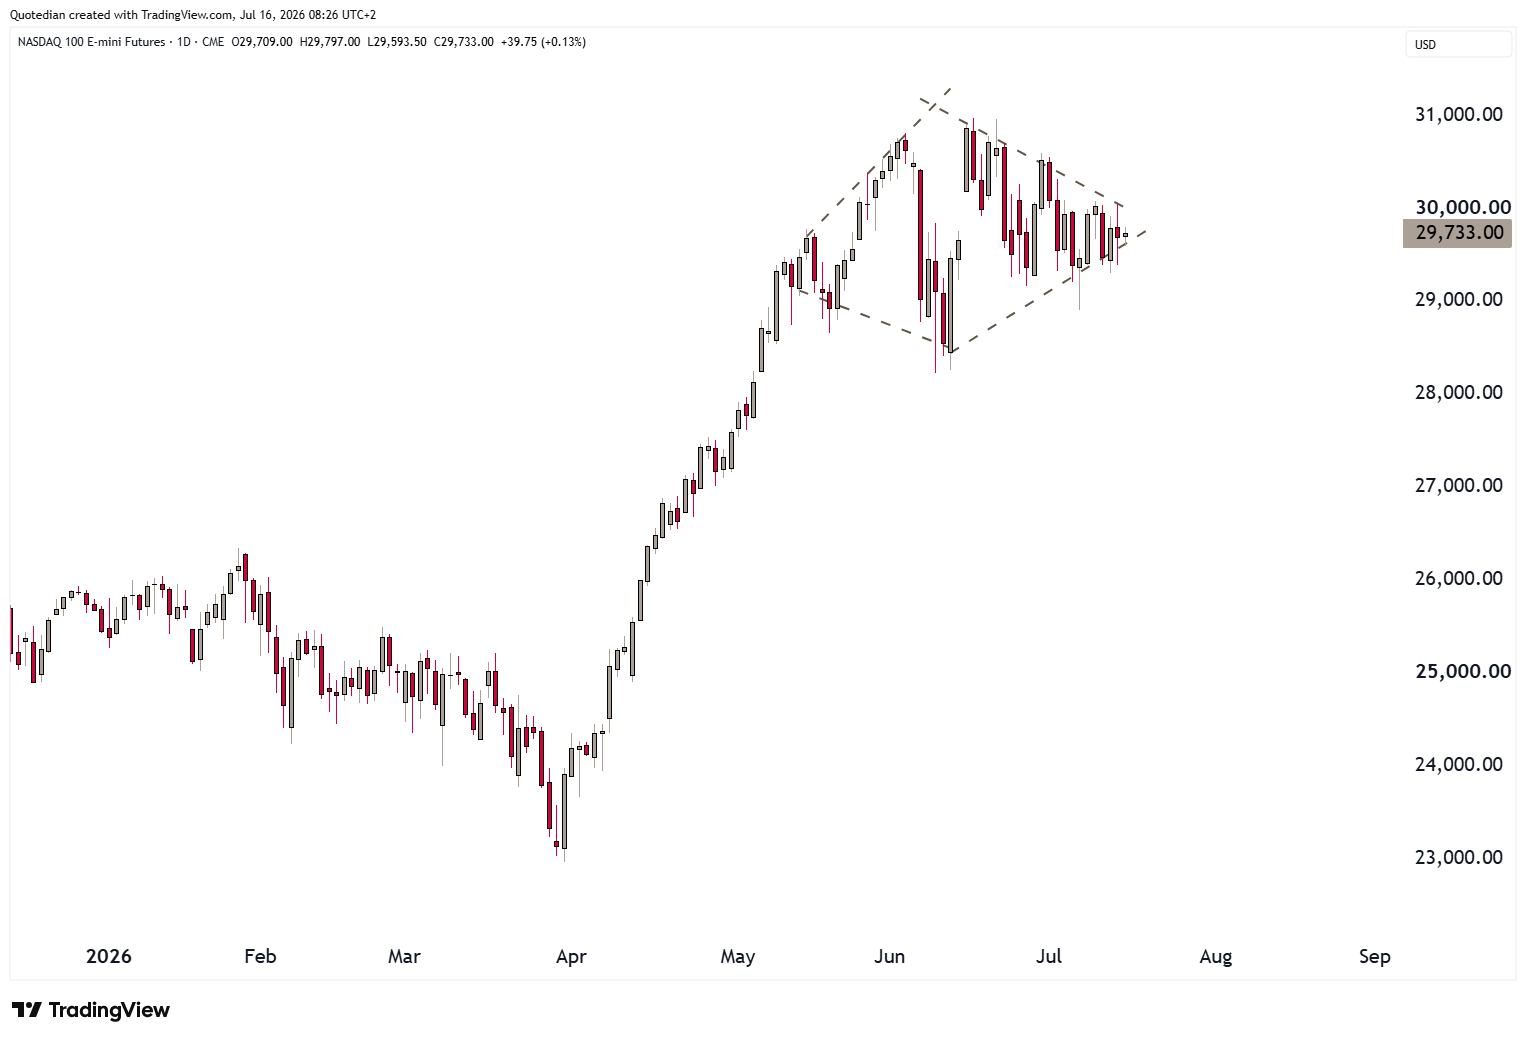
Those dashed lines in the chart above are actually called a diamond formation which tends to be a reversal pattern, i.e. a diamond top in this case. A break lower could mean another 5-8% downside for this index…
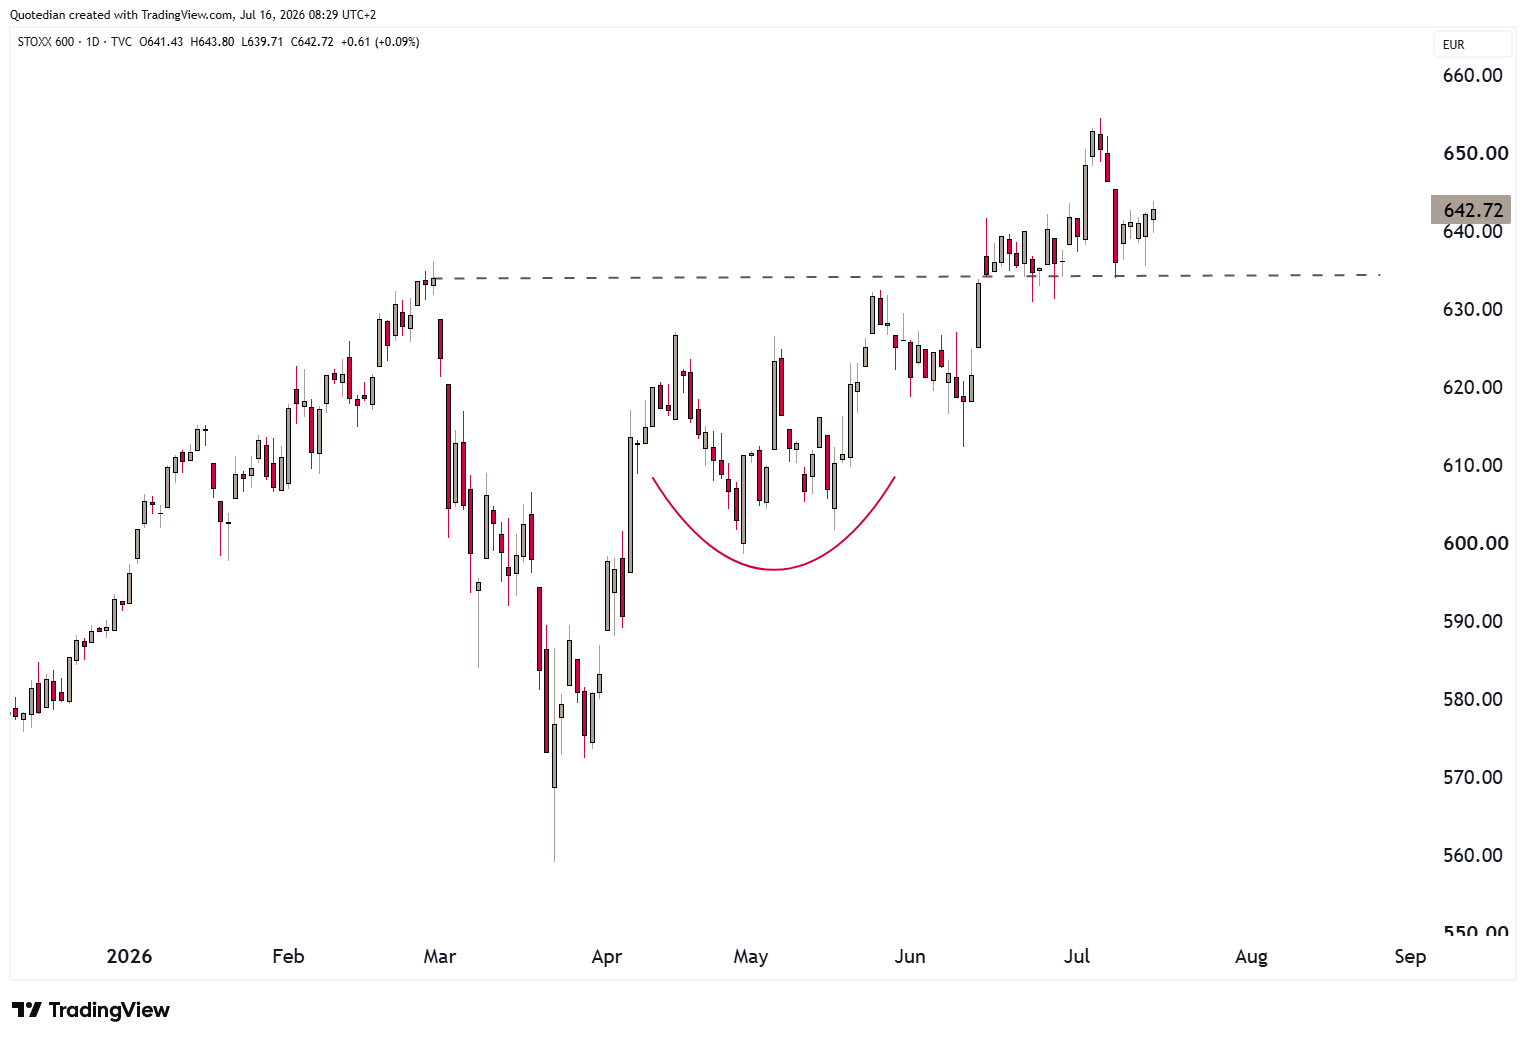
European indices are holding on bravely to recent gains, but also struggle to provide significant further advances:
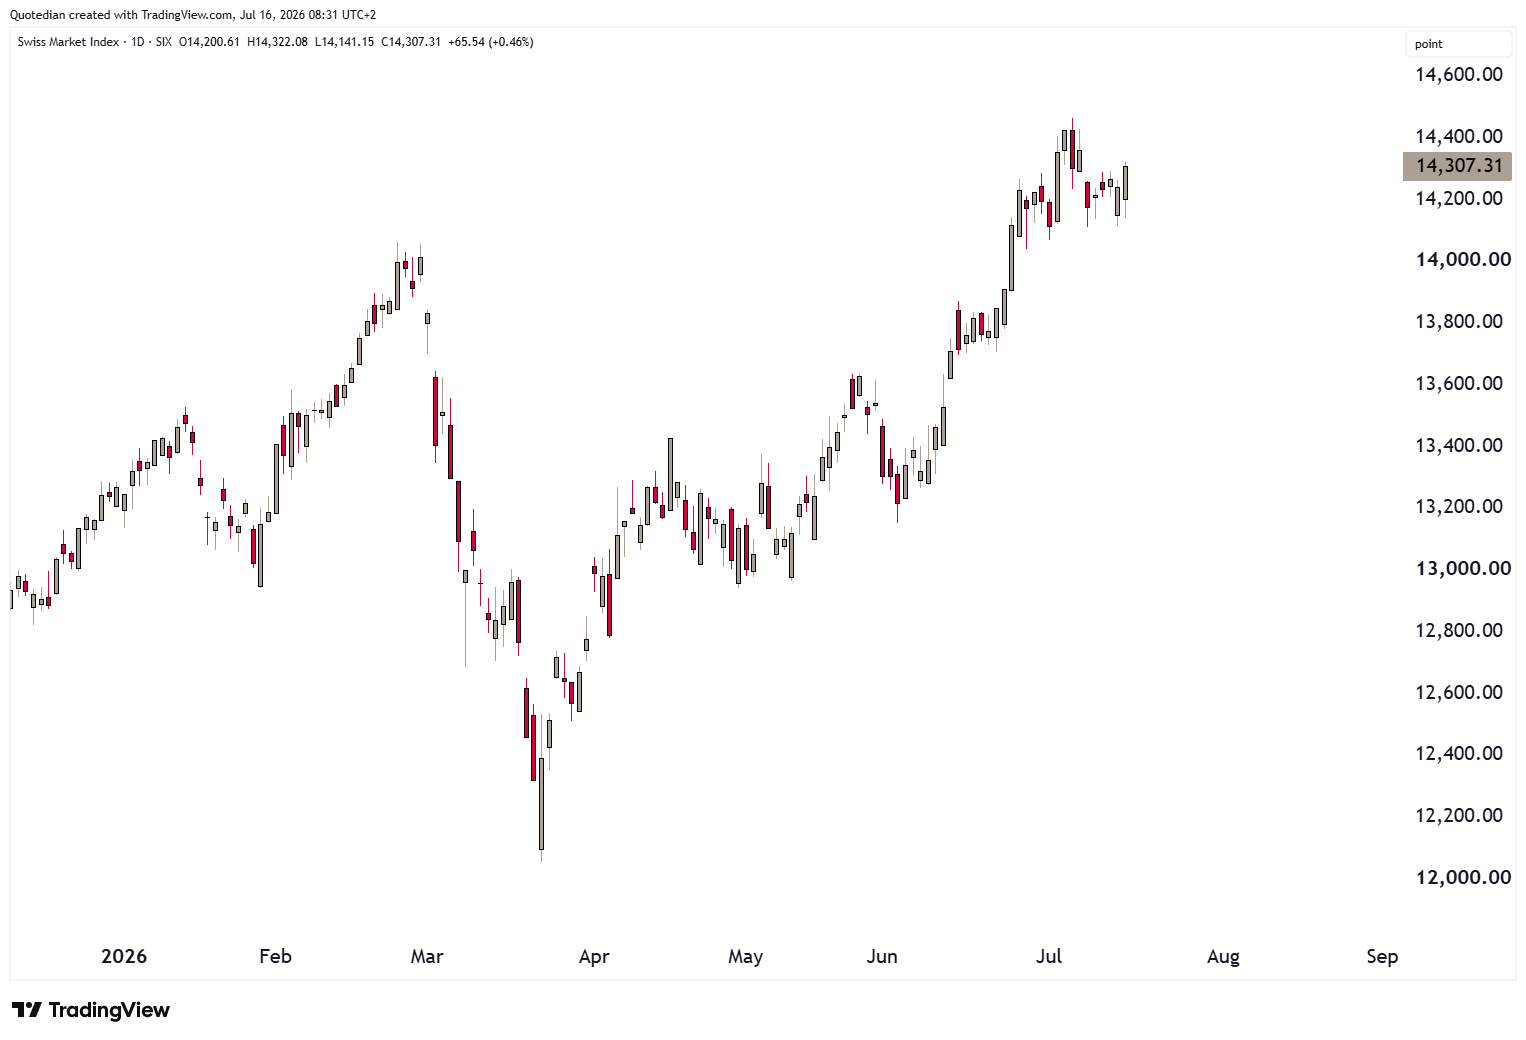
Switzerland’s (defensive …) SMI may be one of the most constructive charts on the old continent:
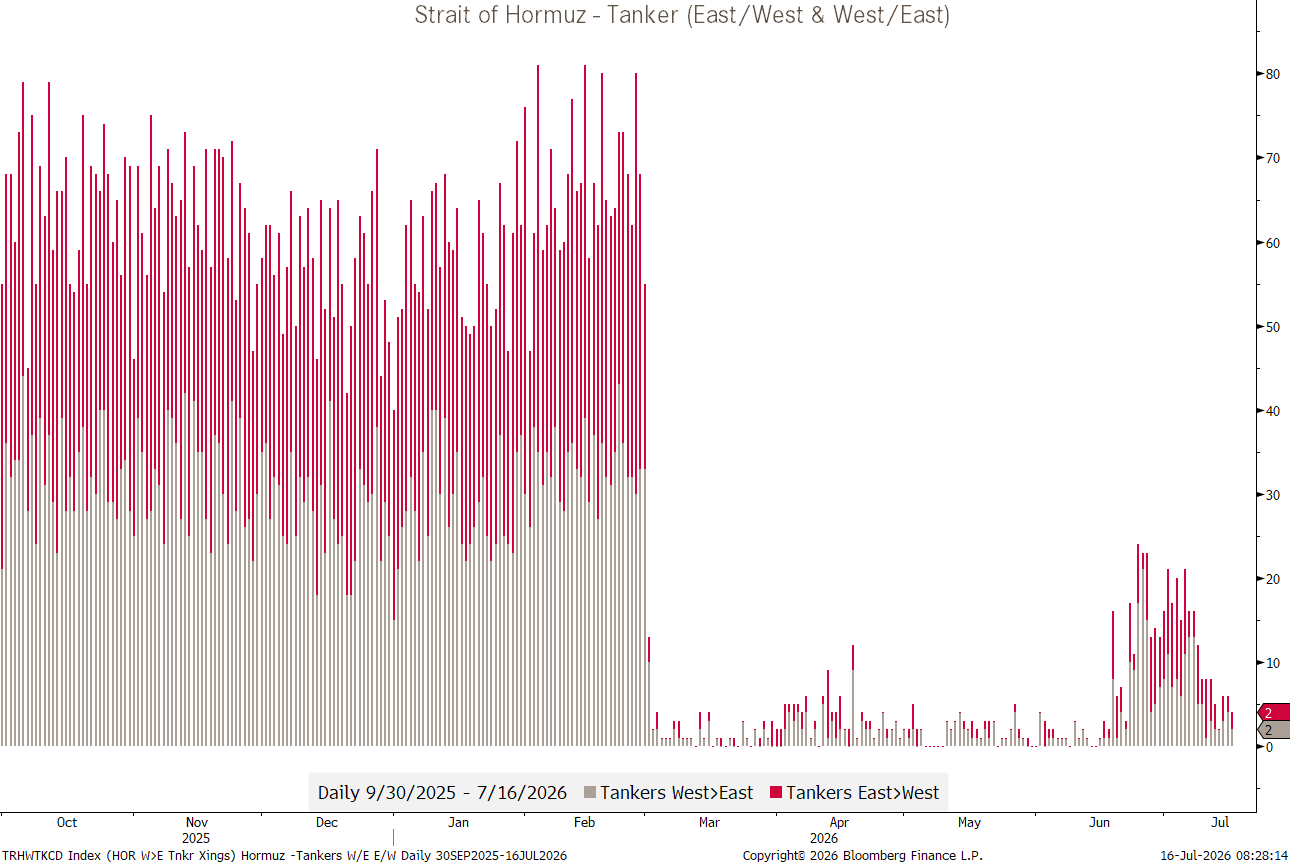
Another topic “du jour” or “du année” is of course the Strait of Hormuz (SoH), where tanker crossing has undeniably slowed again:
Suddenly, the US strategic petroleum reserves are a topic again:
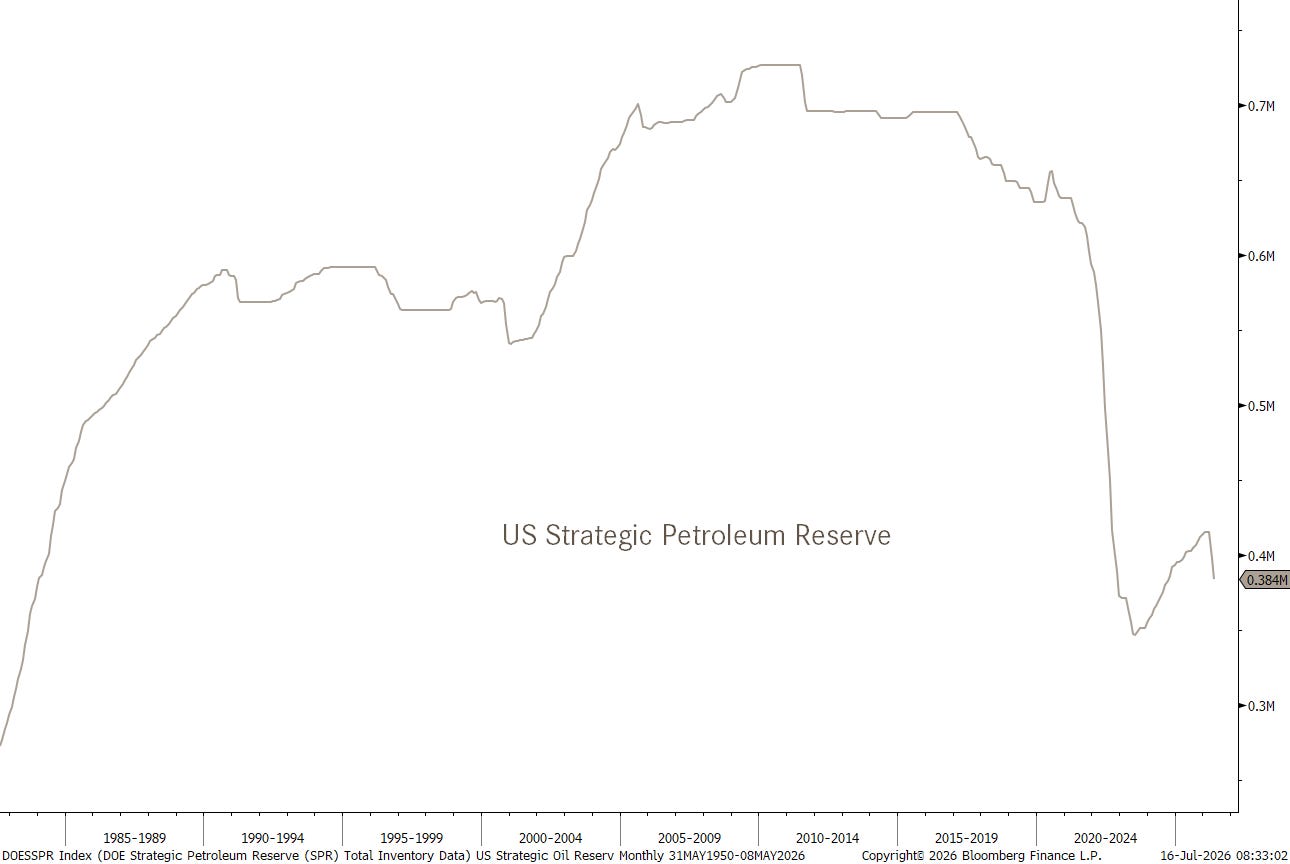
The question being, of course, are those numbers even true and is the oil at the bottom of the barrel (figuratively speaking) actually even usable at all?

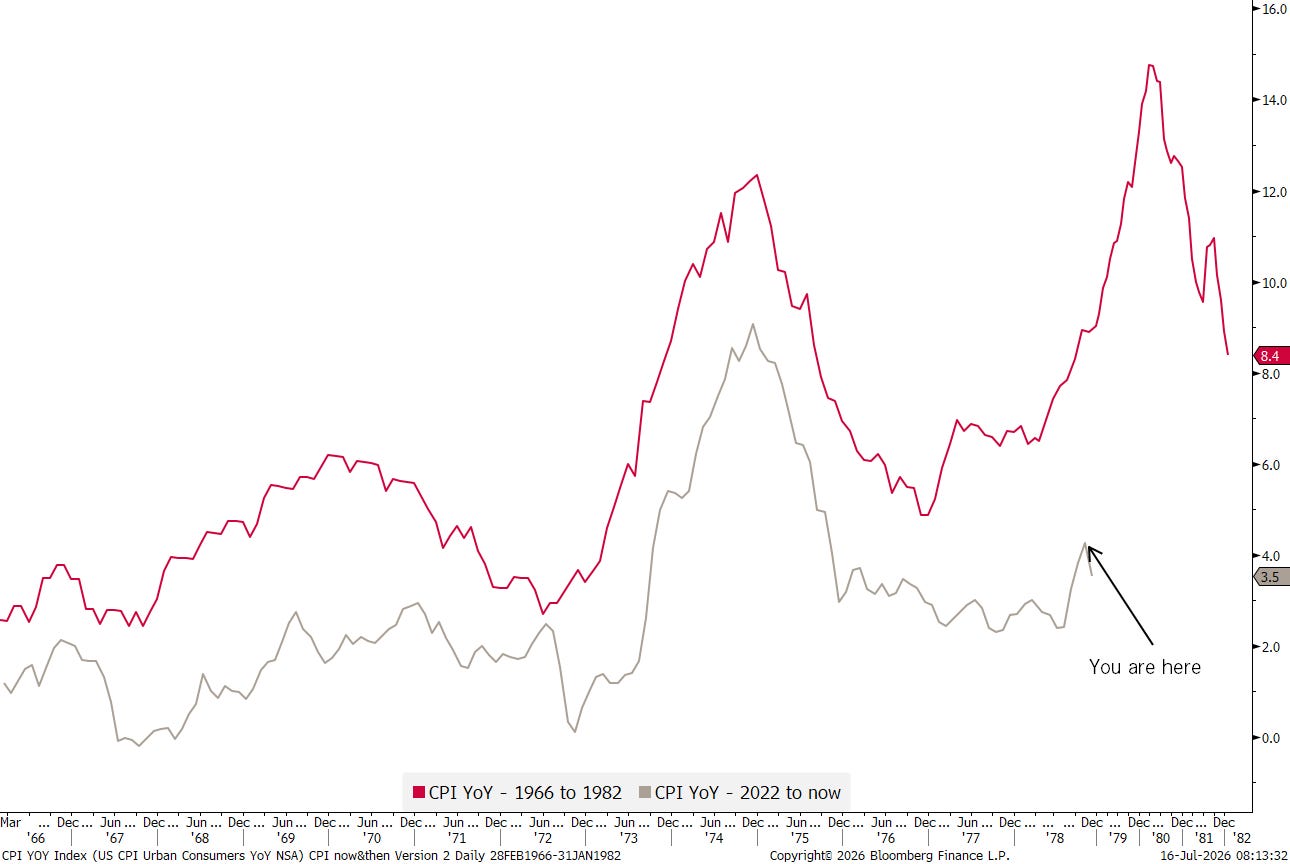
Today’s chart of the day looks at that optical illusion, that Fata Morgana, that the inflation numbers in the US were this week.
Both, consumer price inflation (CPI),

AND producer price inflation (PPI),

reported numbers not only lower than the previous month but also well below analysts’ expectations (for what they worth…).
However, taking that latter PPI number and excluding energy prices, which we all know dropped dramatically post the ceasefire announcment (and which we also know have turned up again meanwhile), we note that inflation continued to rise also during June:
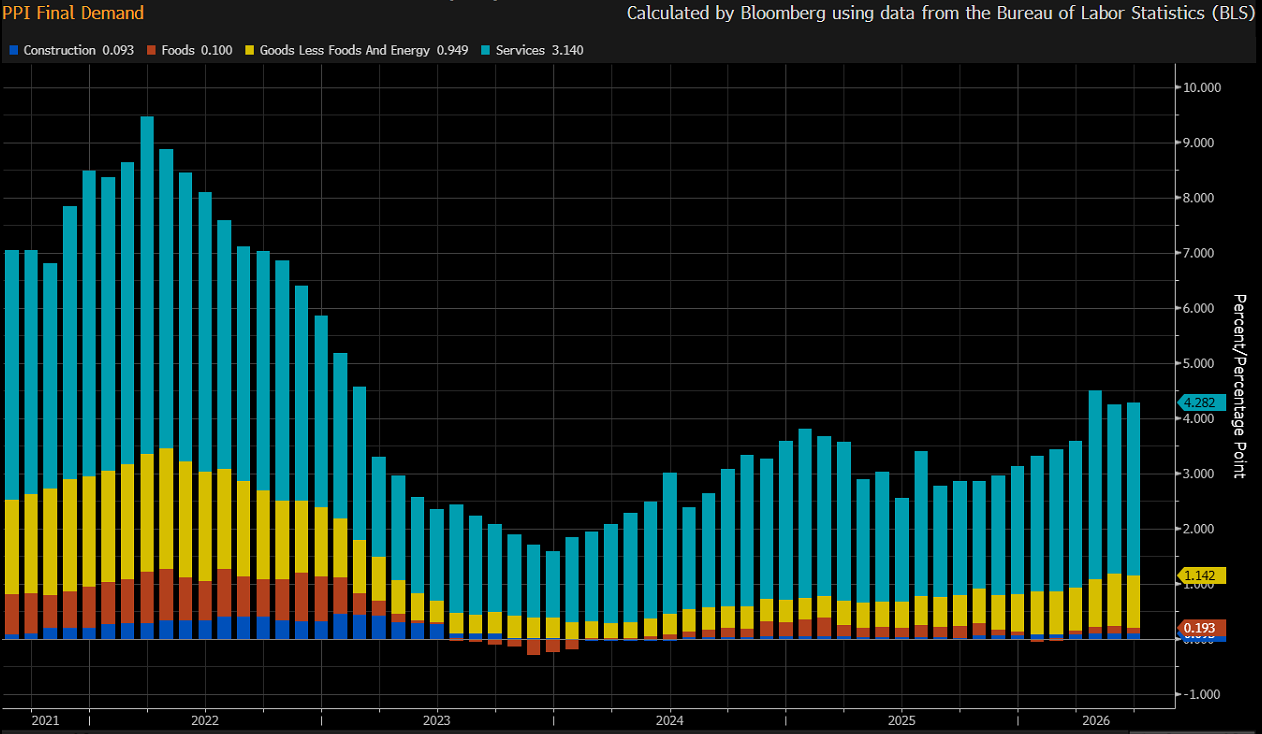
This reinforces our view that the following chart we have been observing for years and which we just republished in the accompanying chartbook to our Q3 outlook (ping me at ahuwiler@npb-bank.ch if you want a copy), still holds some validity:
Have a great day!
André


Everything in this document is for educational purposes only (FEPO)
Nothing in this document should be considered investment advice
Investing real money can be costly; don’t do stupid shit
Leave politics at the door—markets don’t care.
Past performance is hopefully no indication of future performance
The views expressed in this document may differ from the views published by NPB Neue Privat Bank AG