

“Expect the best, plan for the worst, and prepare to be surprised.”
— Denis Waitley

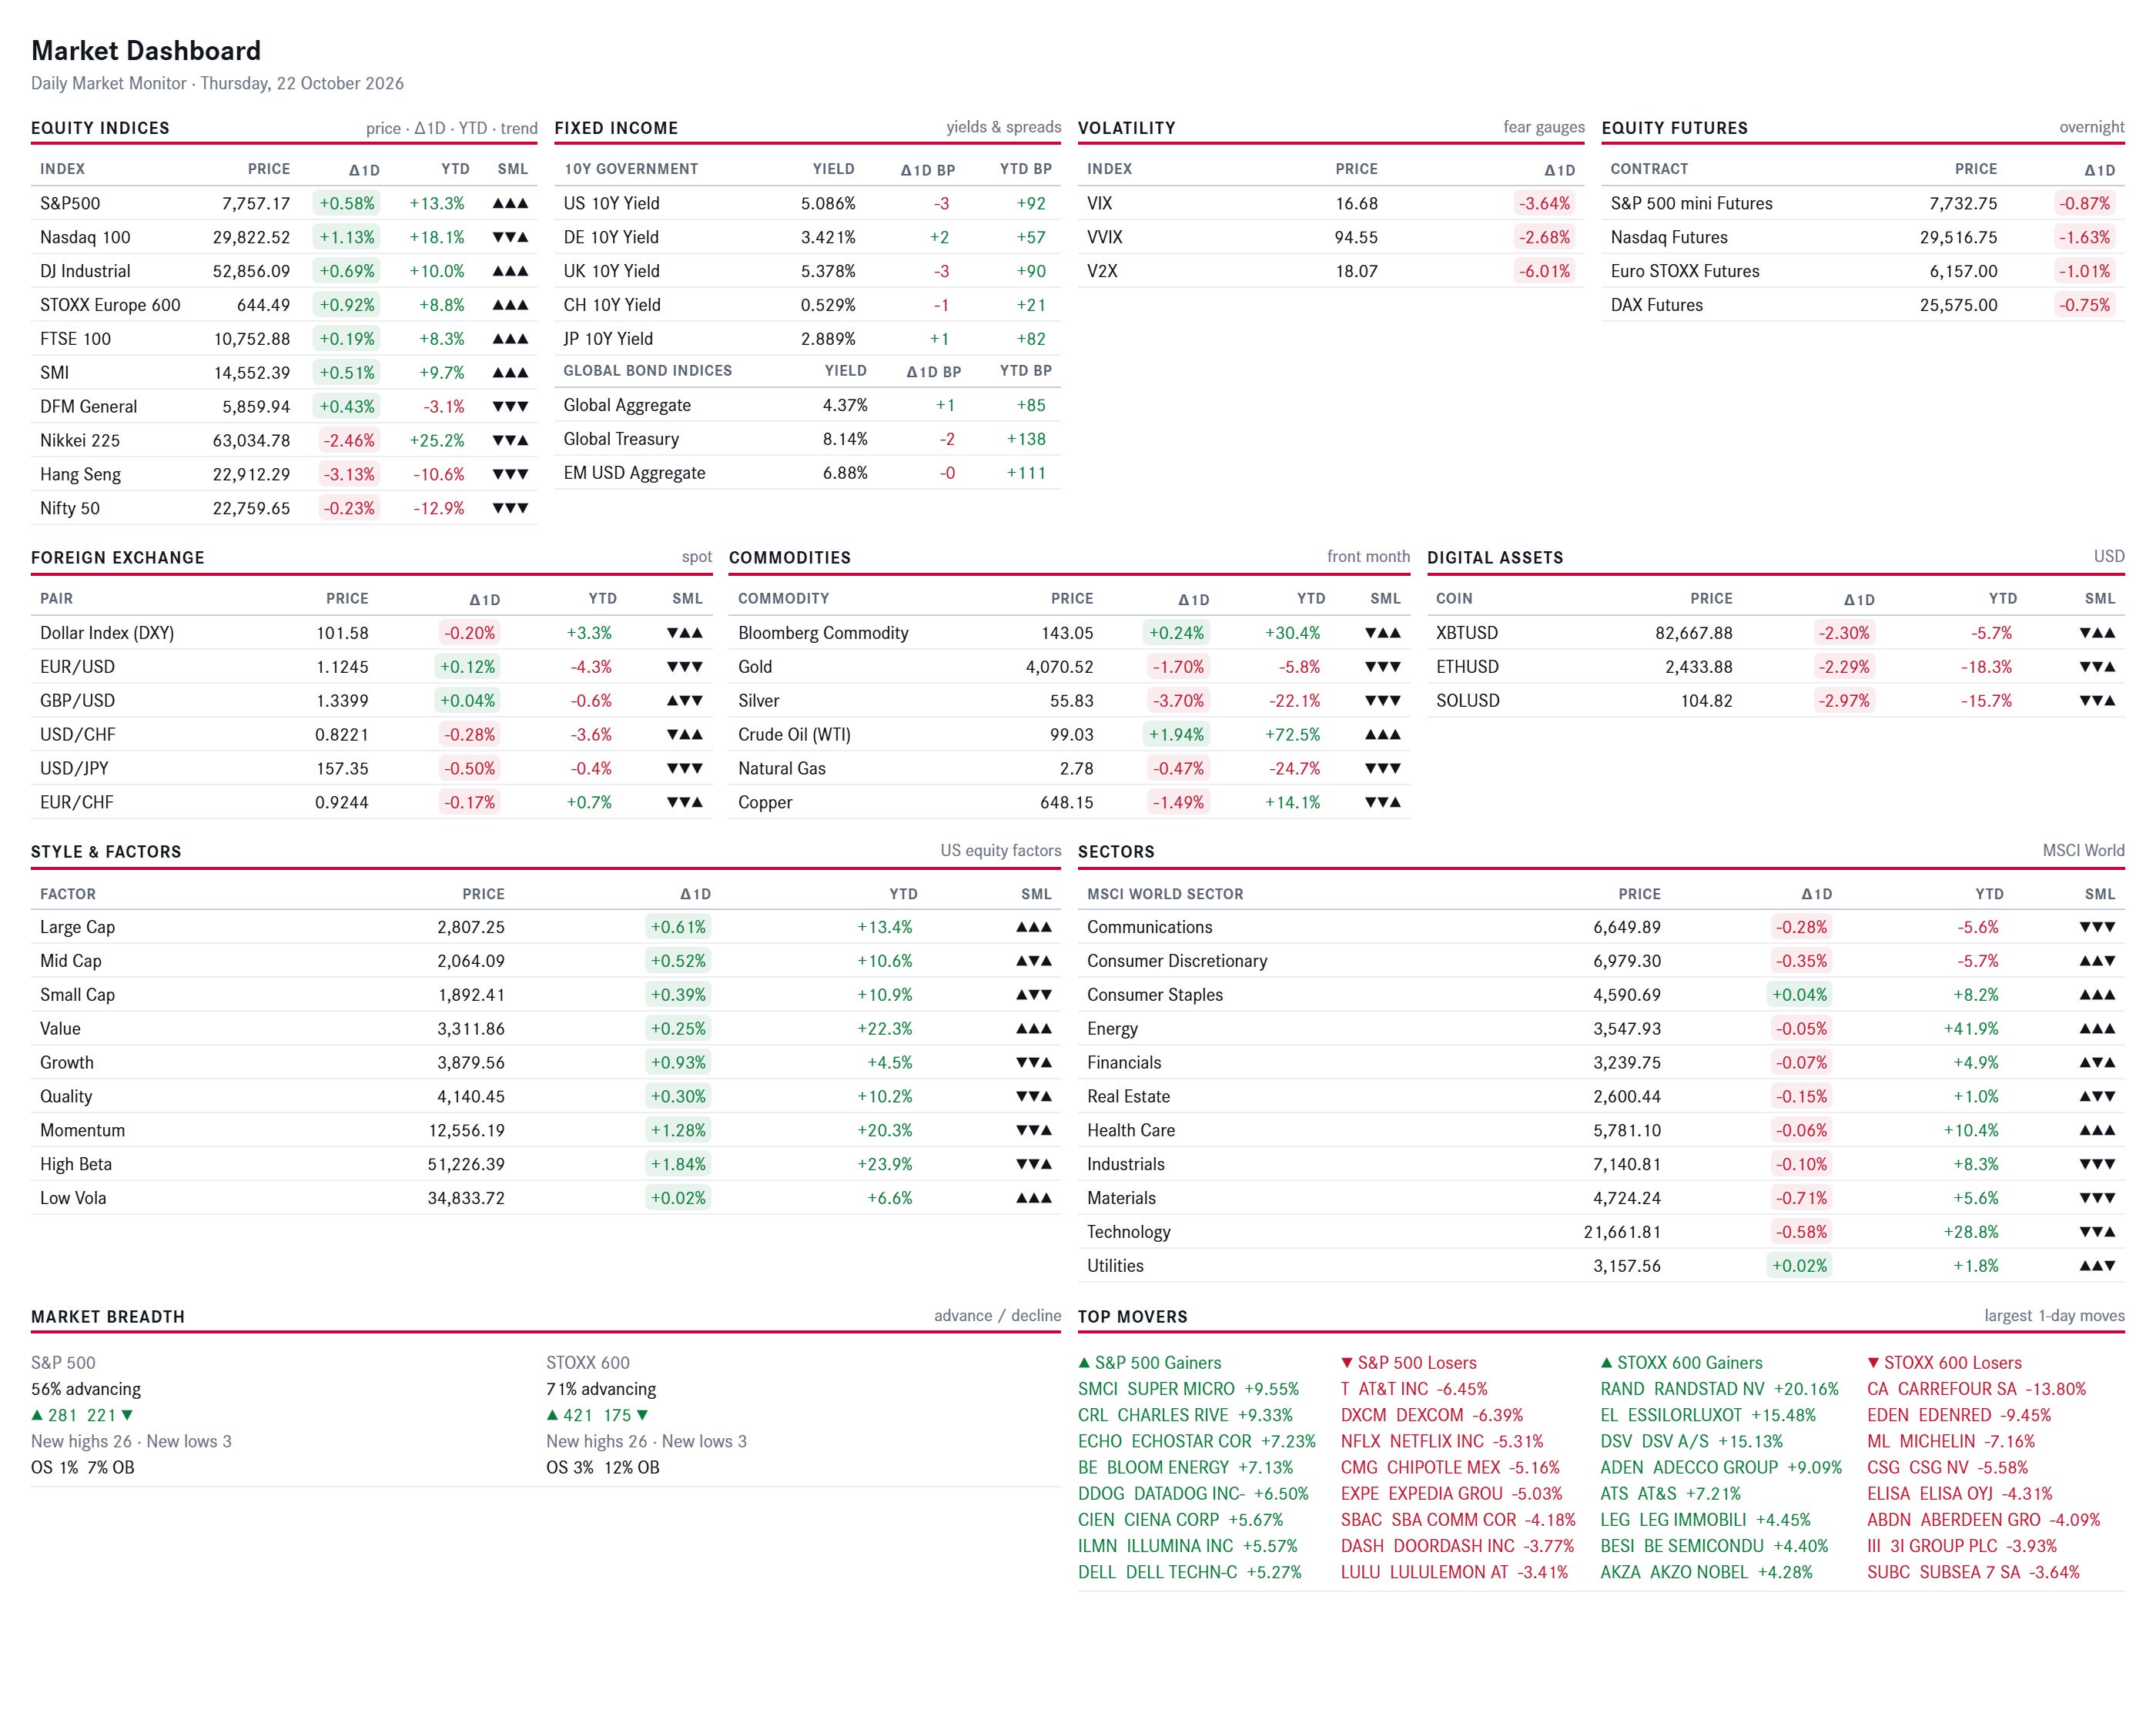
For the full dashboard, please click on ‘Download’ below:


This section of the Daily Q is called ‘The Tape’. As you surely now by now I am an armchair chartist and live by the doctrine “price leads narrative”.
But sometimes it is not enough to just read the Stock Market Ticker Tape…
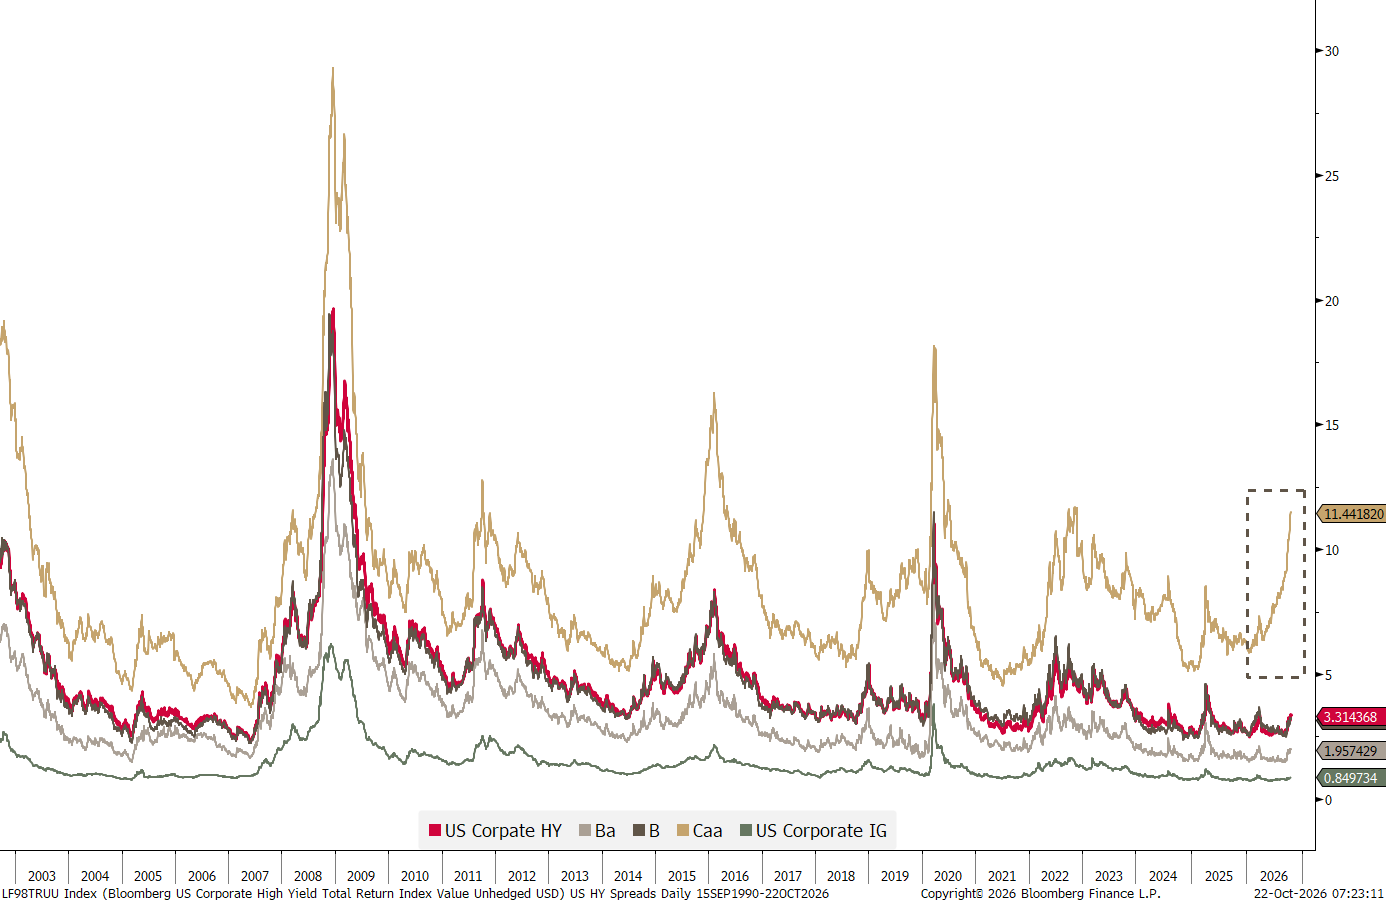
Before important market turning points in the past, it has been a good idea to also read for example the credit market “tape”. E.g., has the lowest quality bucket (CCC- gold line) in the high yield space giving signs of warnings for months now:
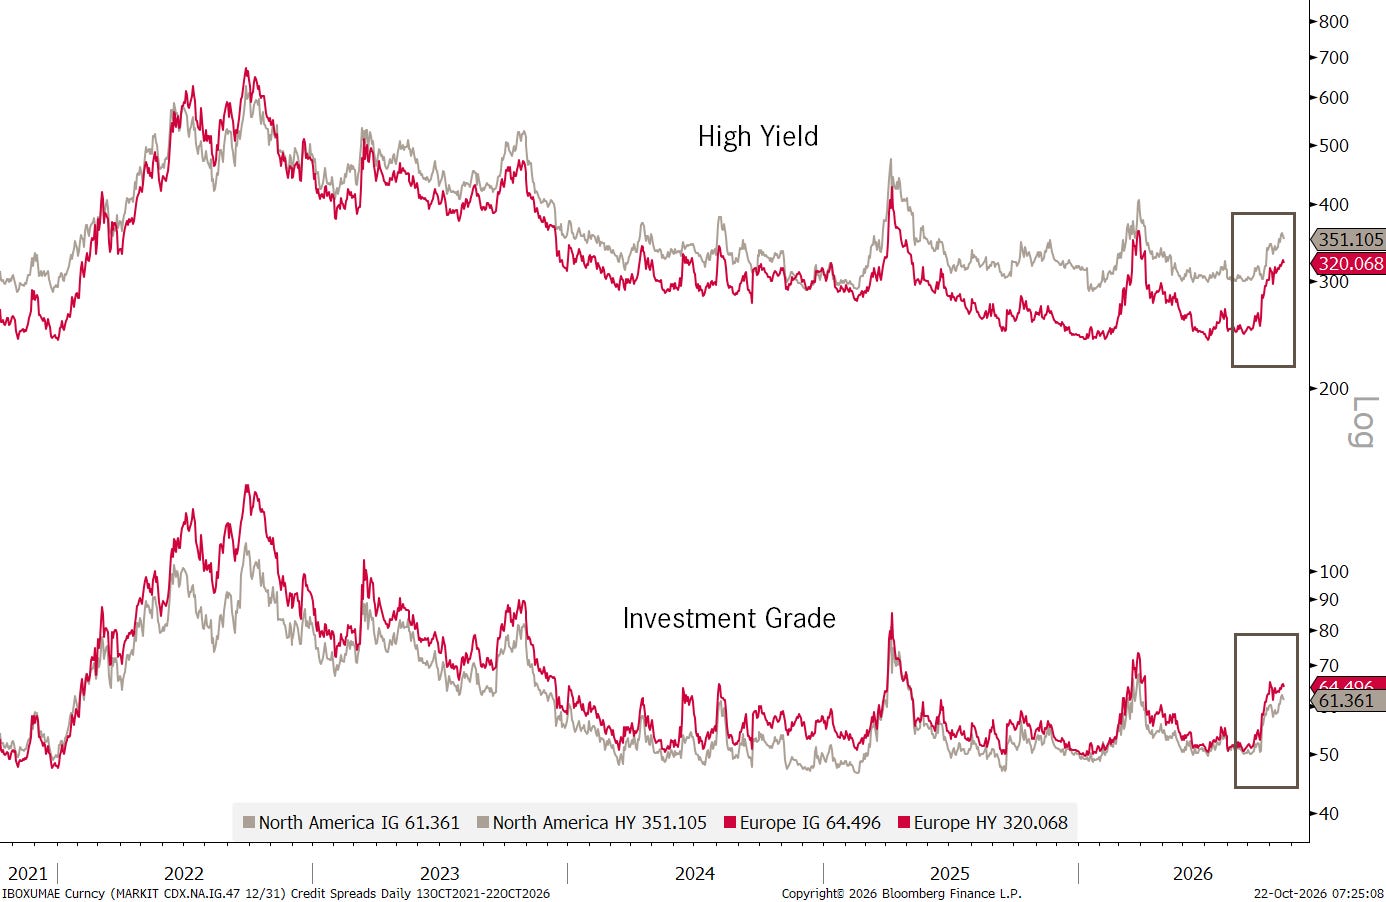
Since mid-September, this has started showing up on the broader credit spread taps too:
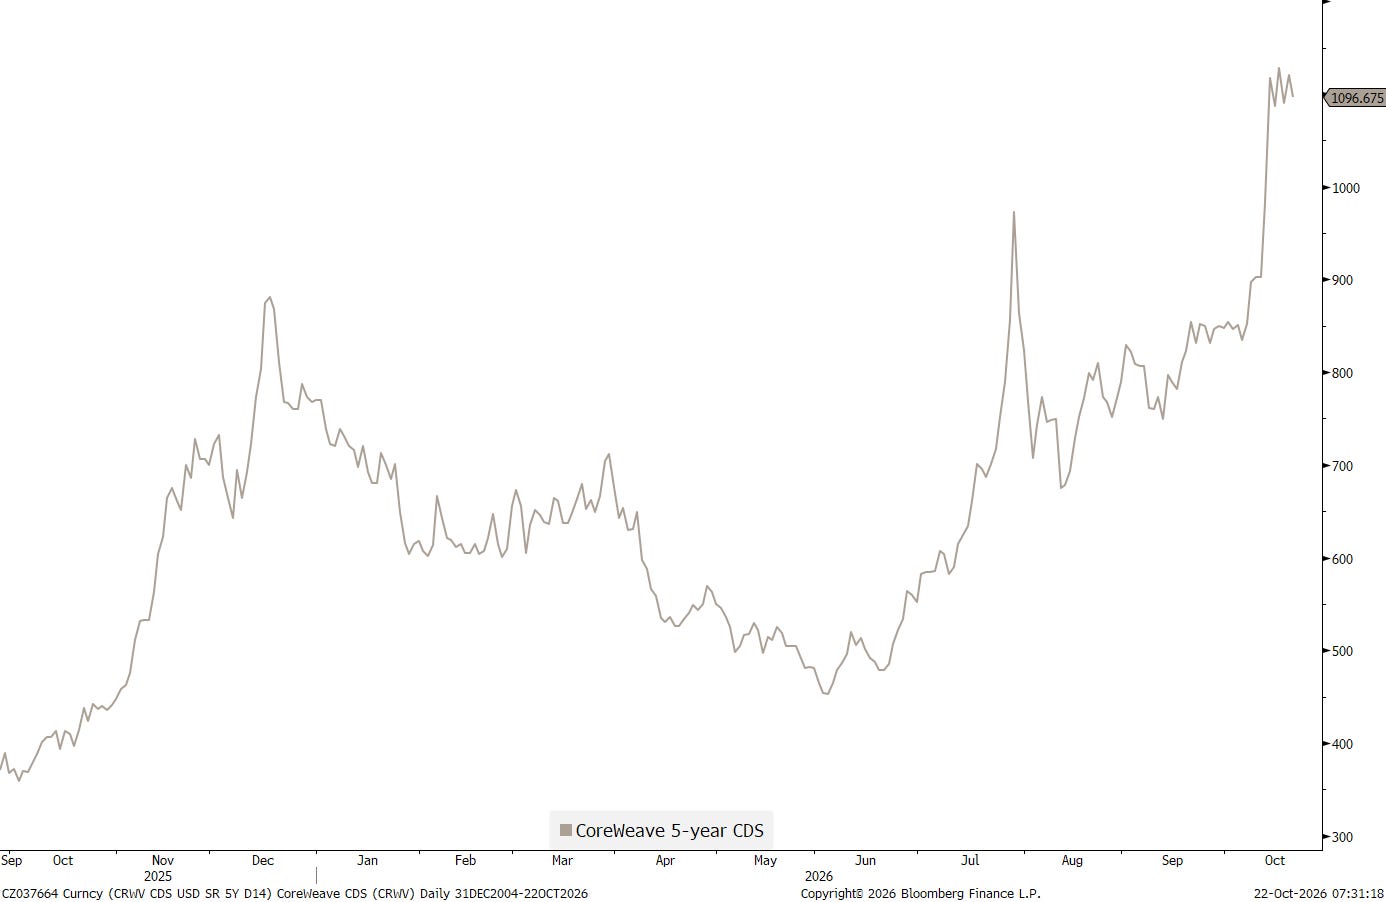
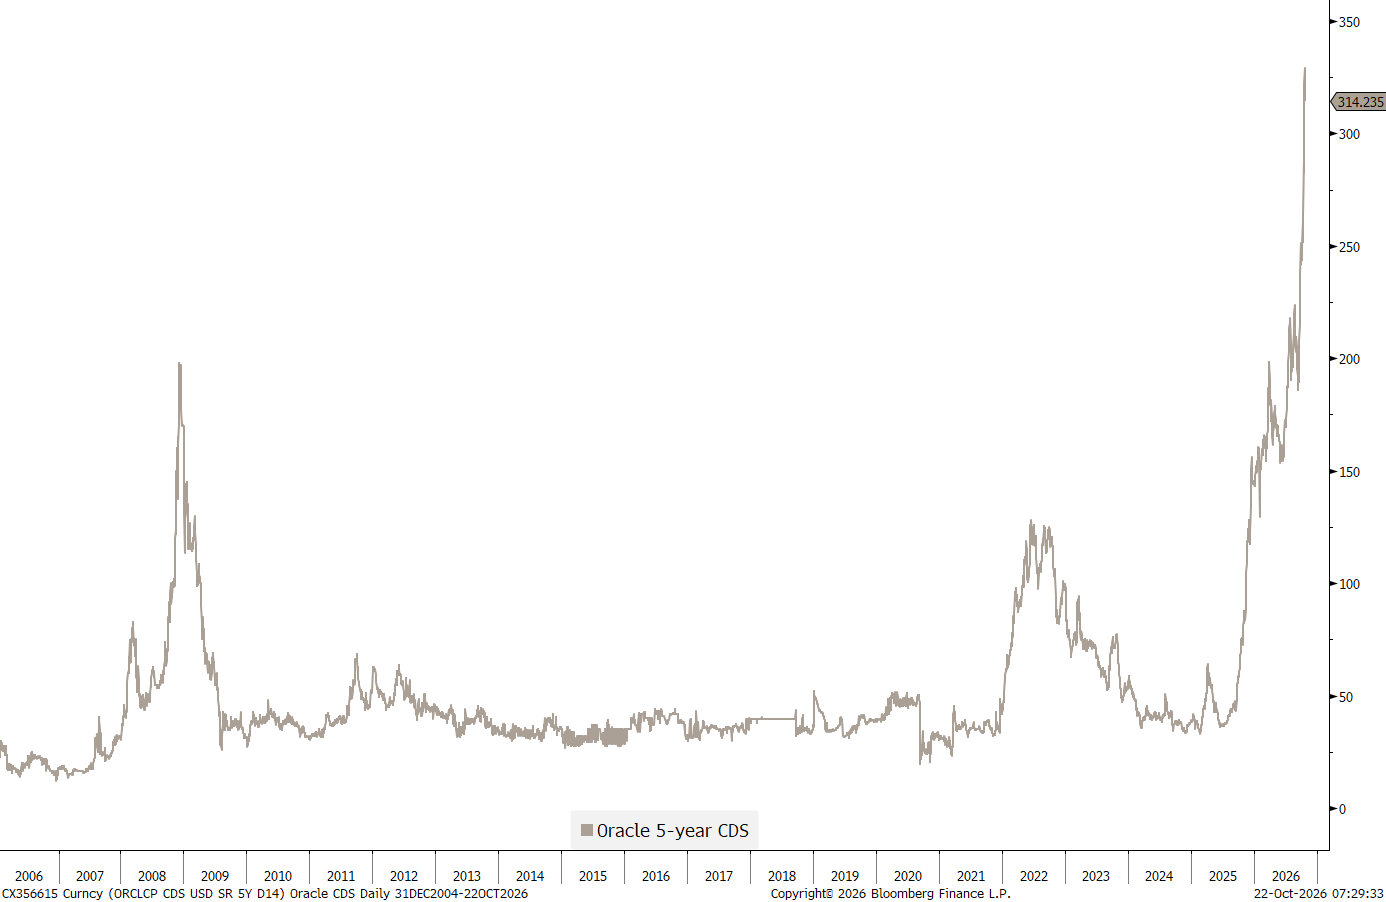
We already discussed the blowing-out of Credit Default Swap (CDS), in our latest weekly Quotedian, titled “Party Like It’s ... 1966!” (click here), released late Monday afternoon.
Examples we showed, included CoreWeave:
And for greater historical context, also Oracle:
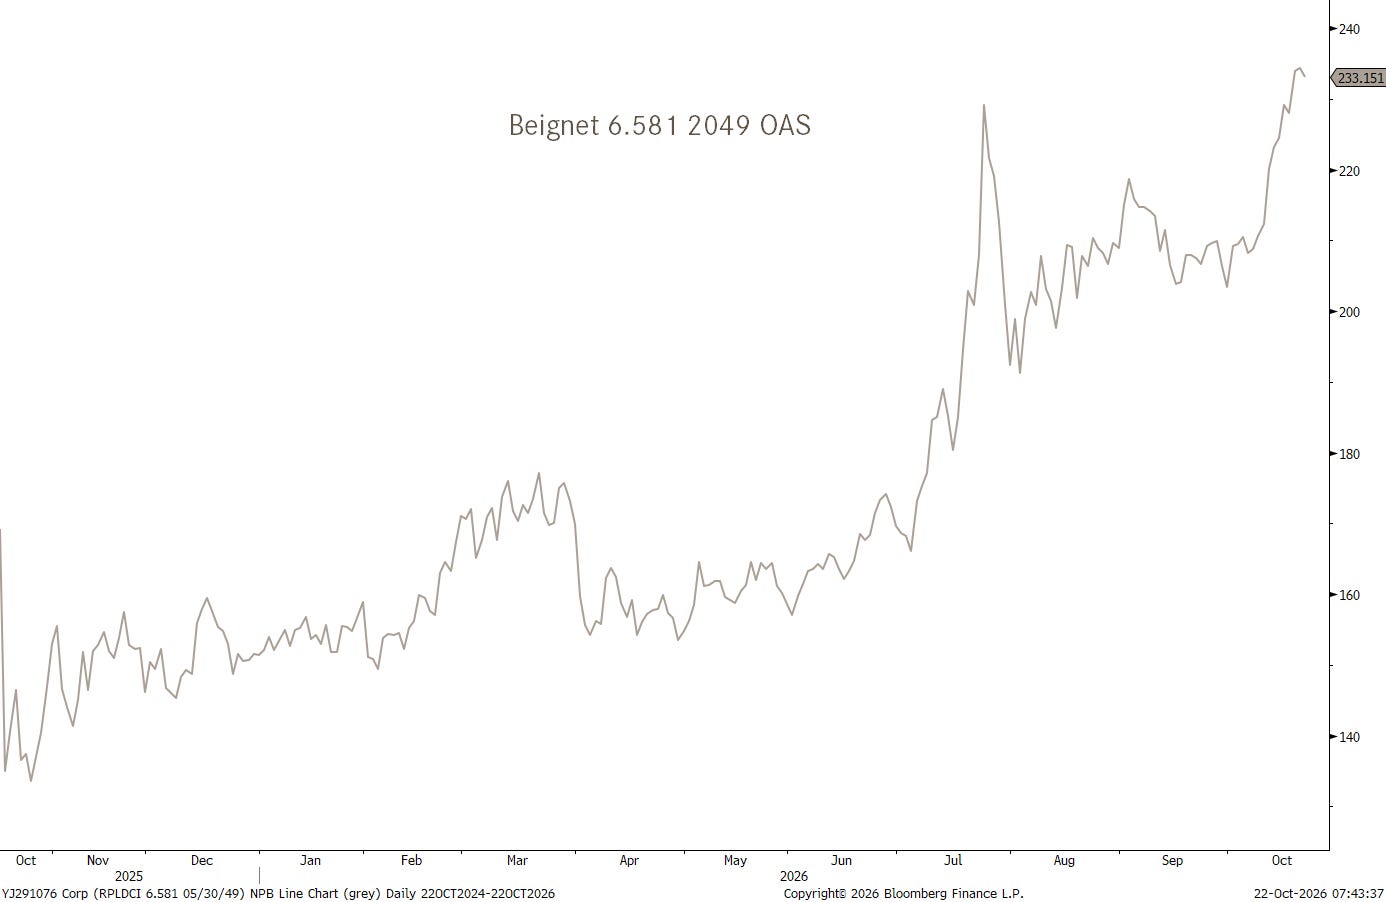
But there’s more …the world’s largest single corporate bond is the Beignet Investor LLC 6.581% of 05/30/2049 with a whopping $27.3 billion outstanding. Beignet is a SPV of Meta and Blue Owl …
After briefly trading close to 110 shortly after issue, it now hovers just above 91. Most of that can of course be explained by rising interest rates over the period since launch, but credit spreads have definitely also been on the move:
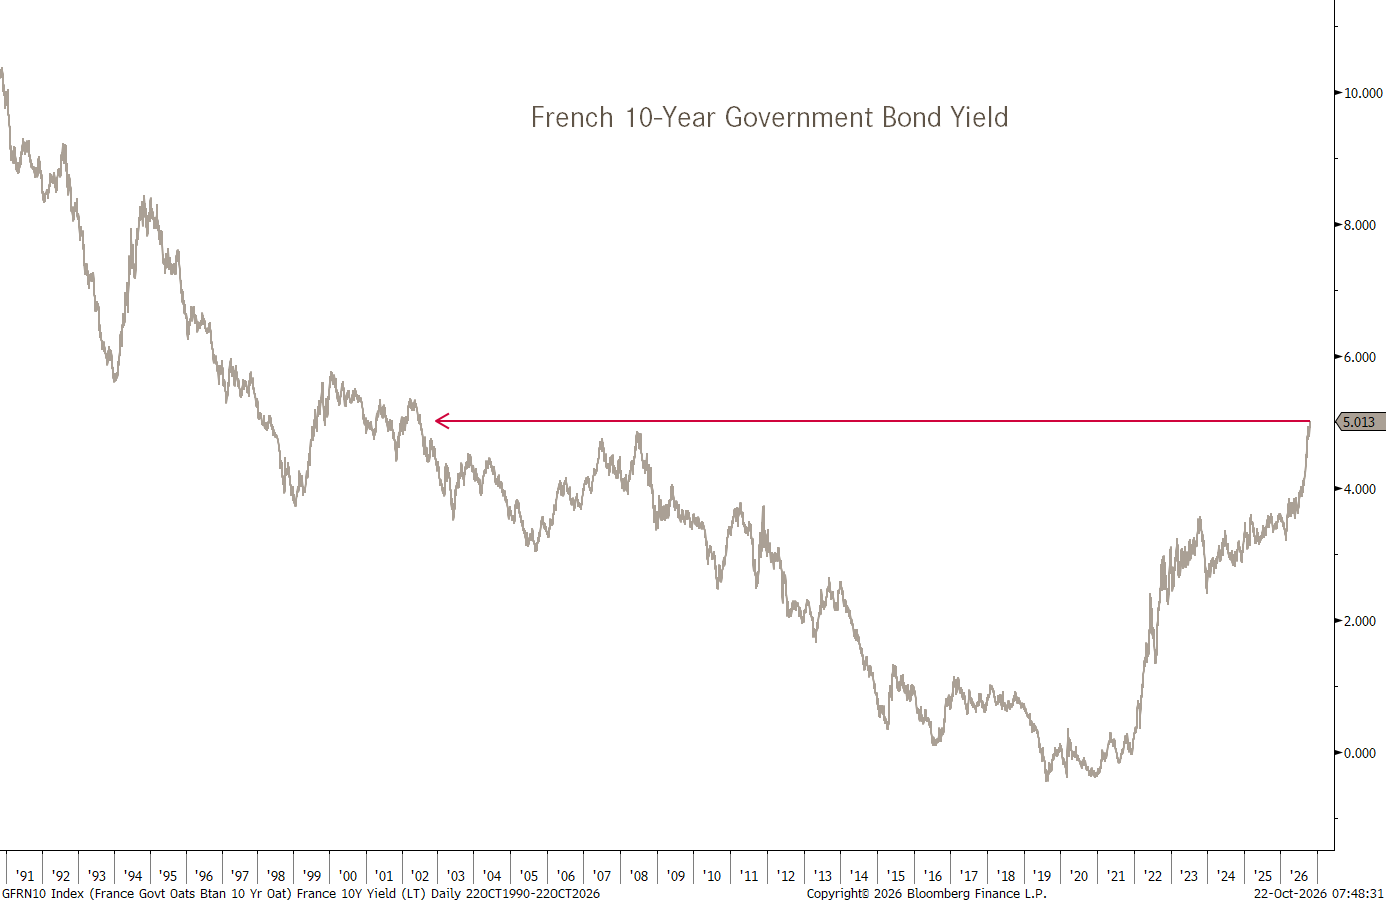
But enough of credit … another tape we should pay attention to, and which lends the subtitle to today’s Daily Q, is that of French government bonds. The 10-year French OAT hit 5% yesterday, a level not seen since 2002 and something tells me it is not due to above-trend growth:
But, of course, also here we need to look at it in ‘relative’ terms to be things into context. In this case, we use the spread to the 10-year German Government Bond:
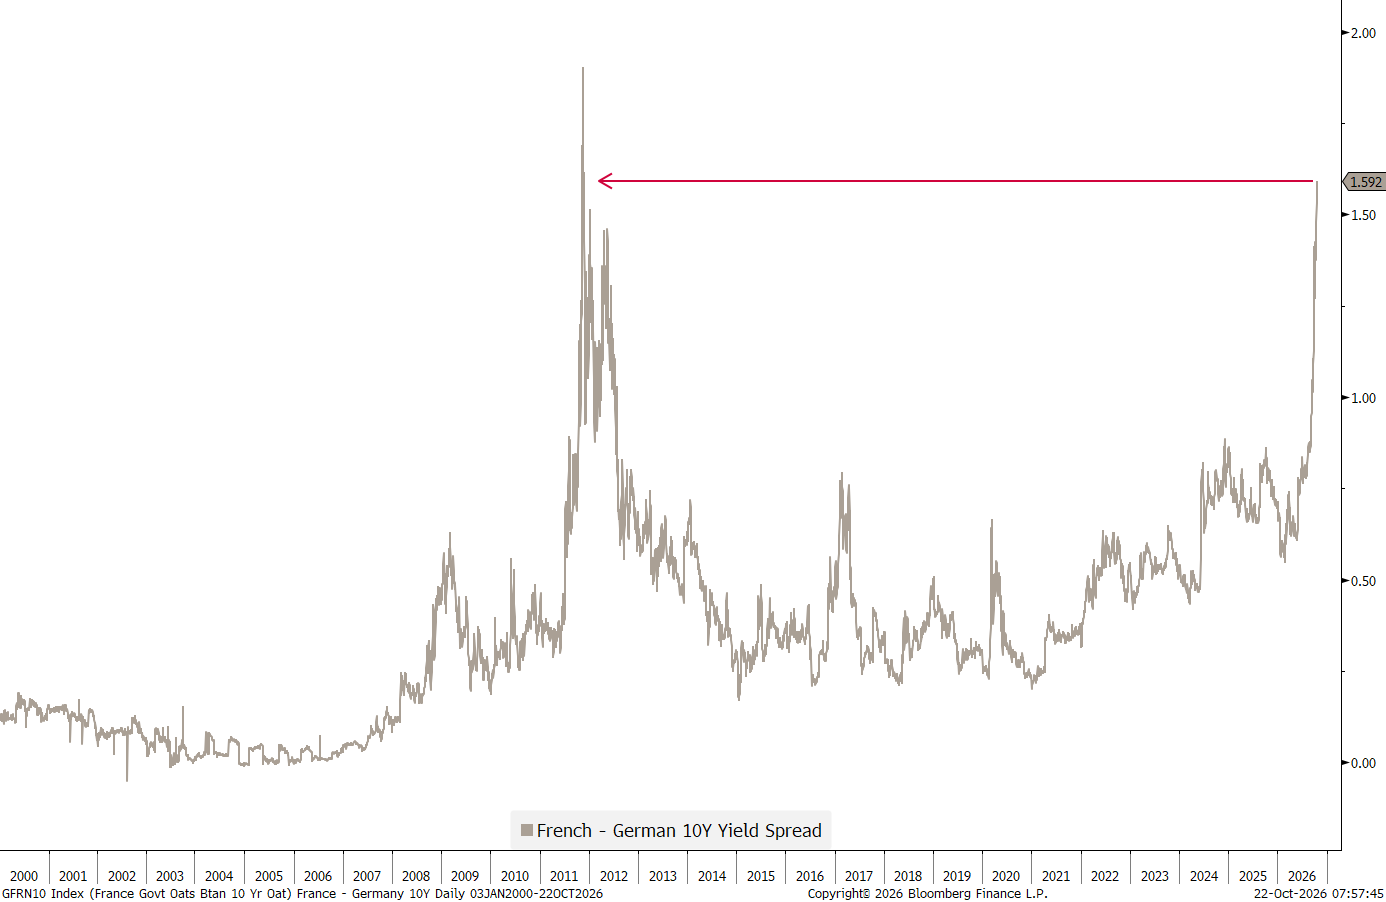
Yikes!
And finally, to assess the overall macro environment (and draw asset allocation conclusions thereof), we should also look at the oil tape. Remember that massive backwardation in oil futures prices when the Iran broke out, implying that traders/investors did not expect the war to last long?
Well, longer-dated contracts are now also hitting new year-to-date highs, indicating that the market is less convinced about a or the end of the conflict:
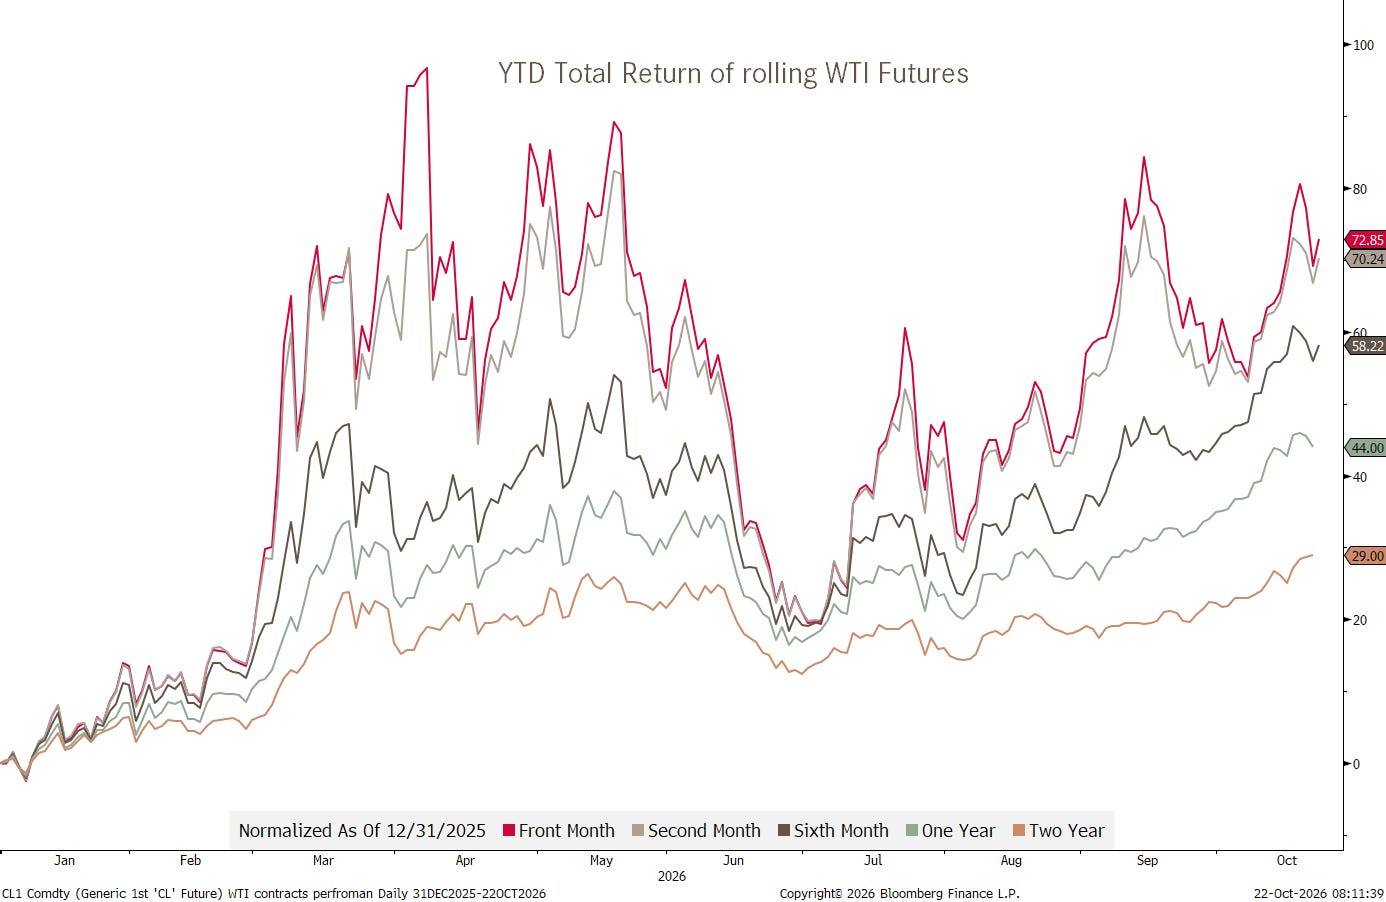
Finally, let’s turn to that stock market tape for a moment, but only briefly so, as it is time to hit the send button.
Walking into the office, listening to the usual financial podcasts, I would have expected markets to be meaningfully higher.
Not so! Asia stocks are down meaningfully:
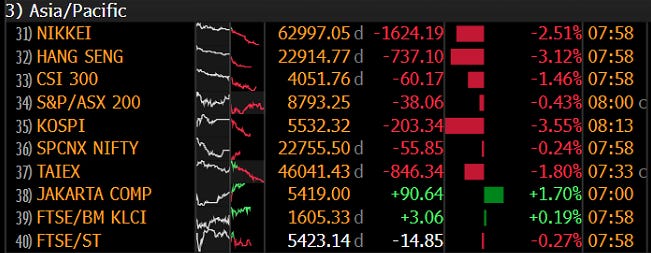
And European and US Index futures forebode a difficult opening of cash trading:


So, realizing that this Q was a bit more a weekly than daily-like issue, let me just conclude with this hopefully self-explaining chart (and the chart of the day below of course):
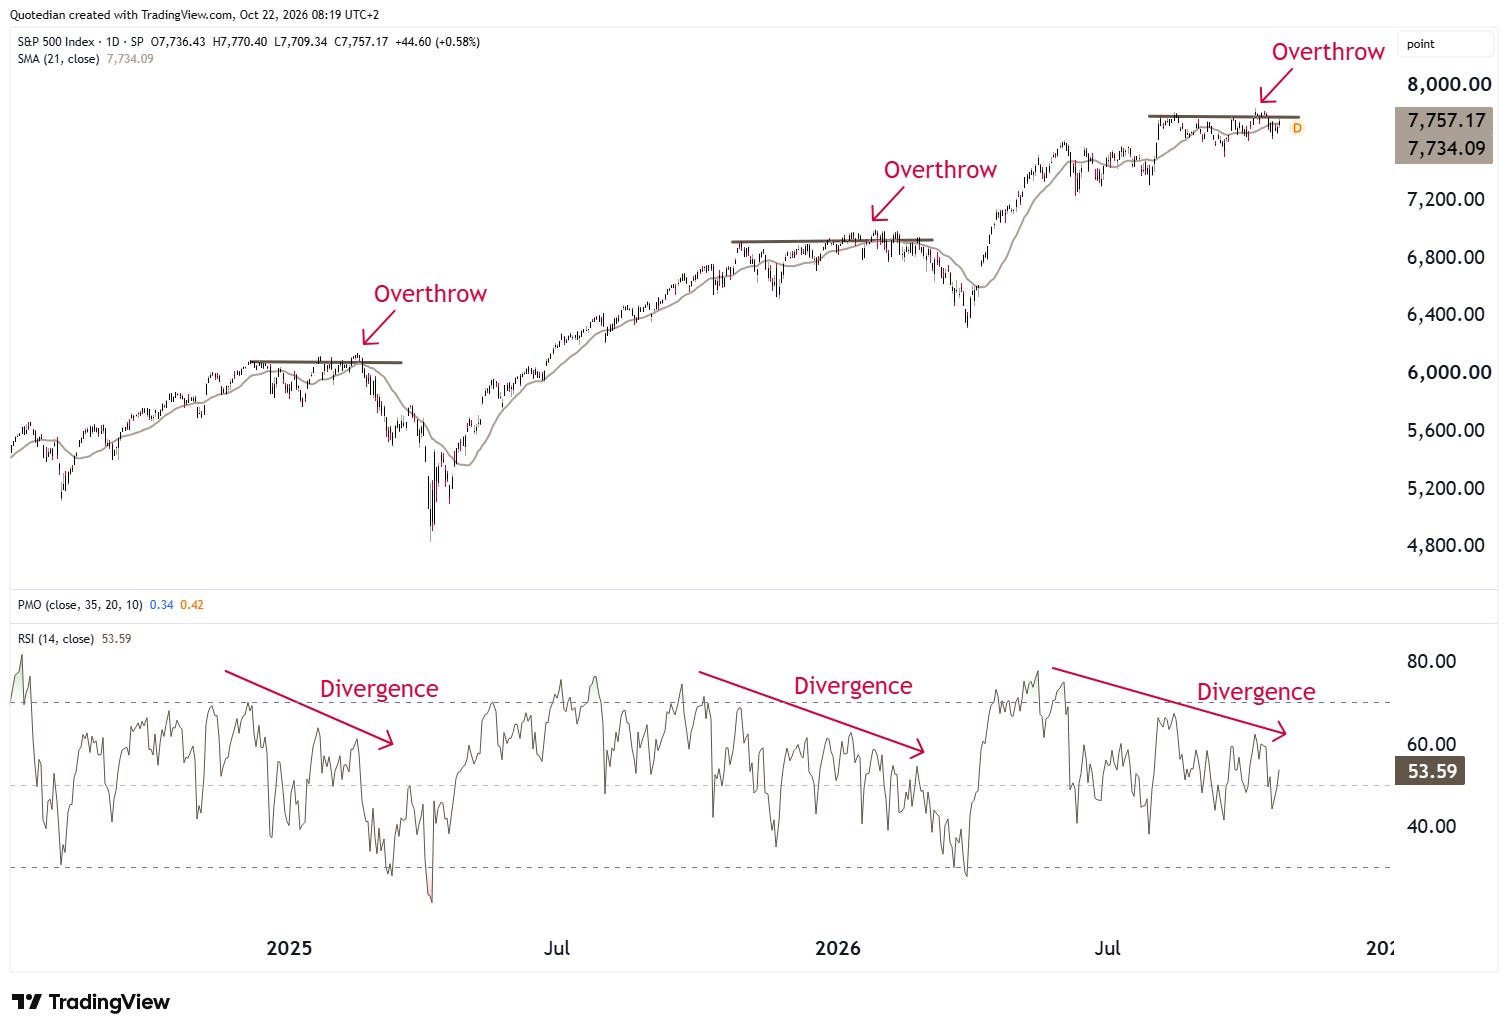
A pattern repeating itself?

While sovereign defaults, particularly among developed nations, are rare, they have happened.
And at a first (uninformed) glance, France is possibly a manyfold European Championship winner in that regard.
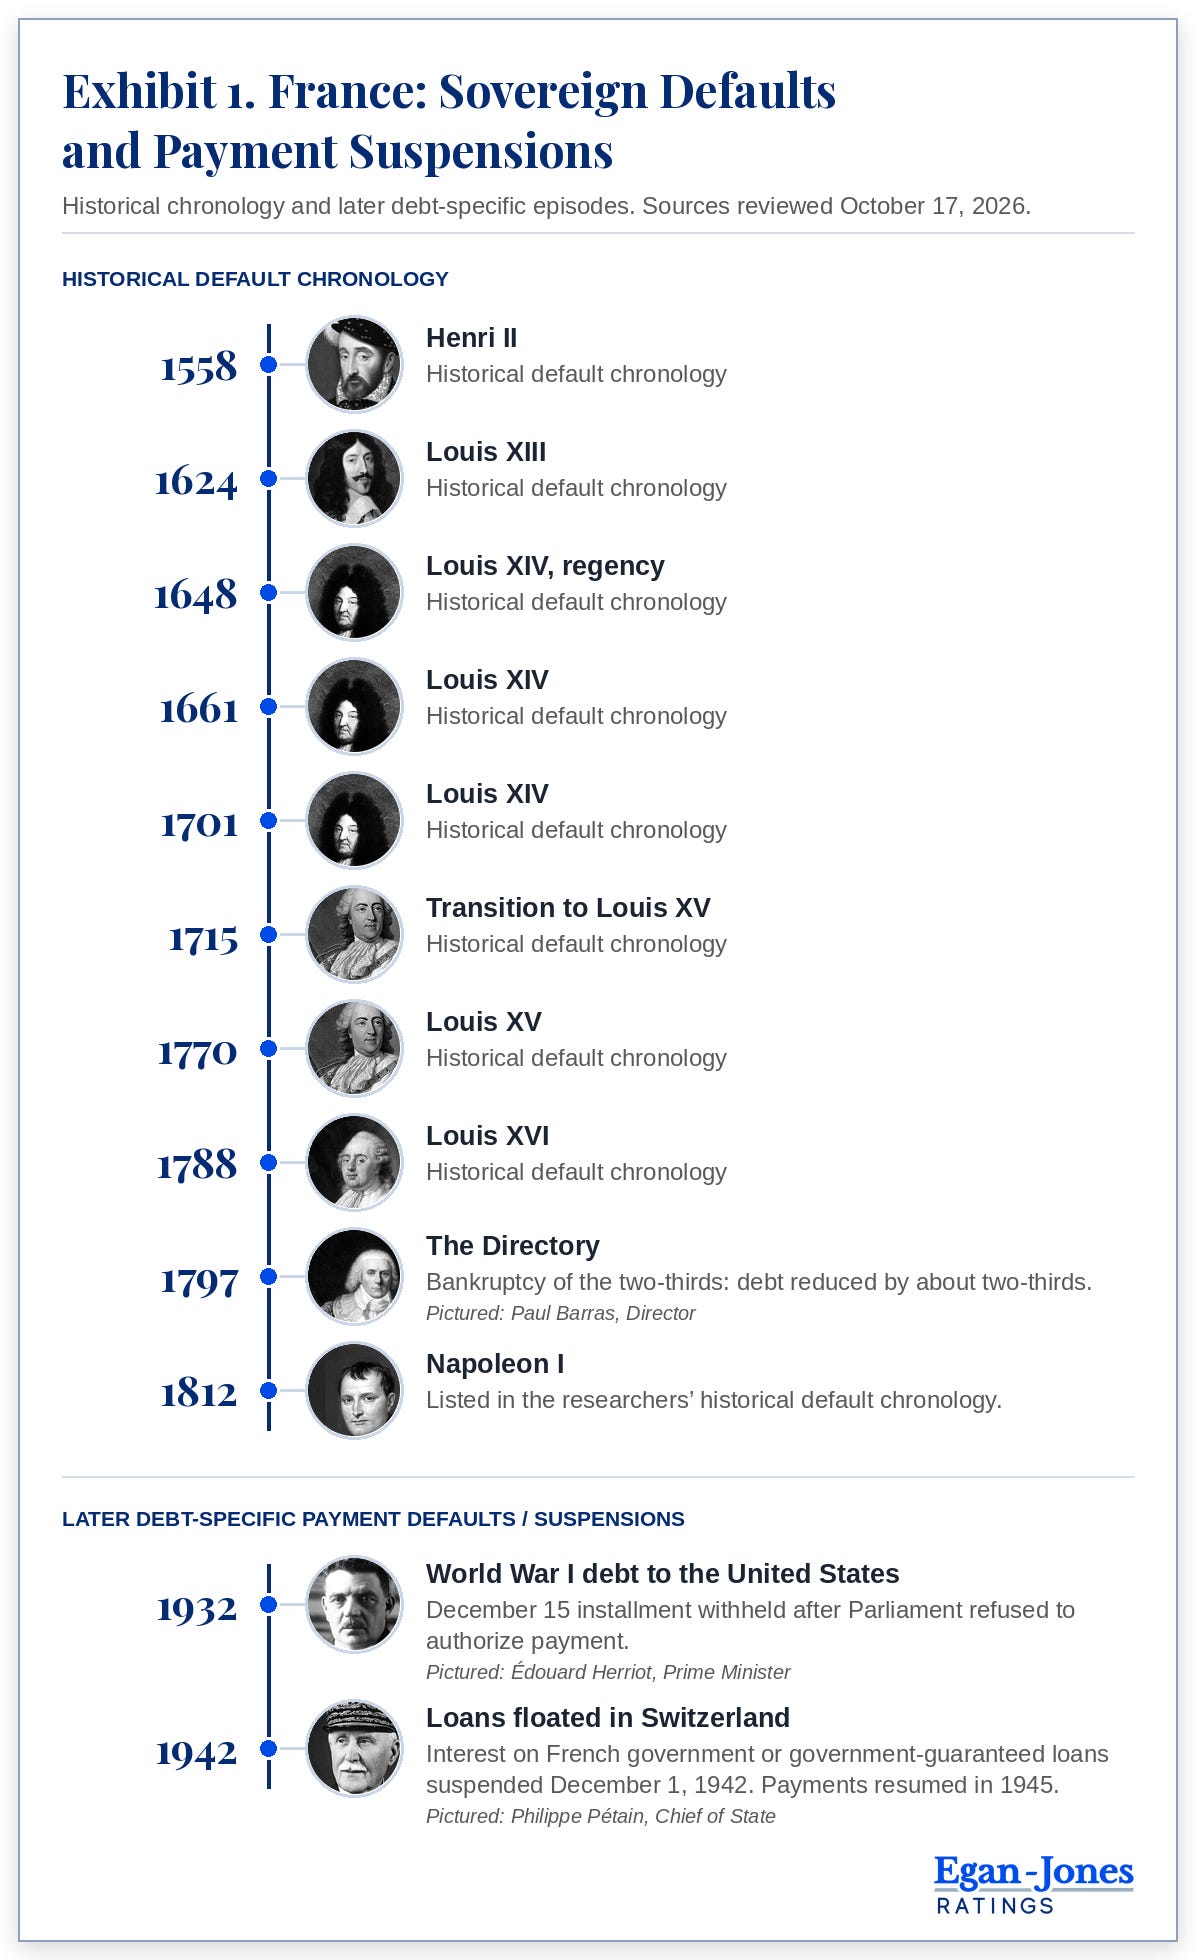
So, again:
“Expect the best, plan for the worst, and prepare to be surprised.”
May the pitchfork be with you!
André

The Important One:
Everything in this document is for educational purposes only (FEPO)
Nothing in this document should be considered investment advice
Investing real money can be costly; don’t do stupid shit
Leave politics at the door—markets don’t care.
Past performance is hopefully no indication of future performance
The views expressed in this document may differ from the views published by NPB Neue Privat Bank AG
The Legal One: