

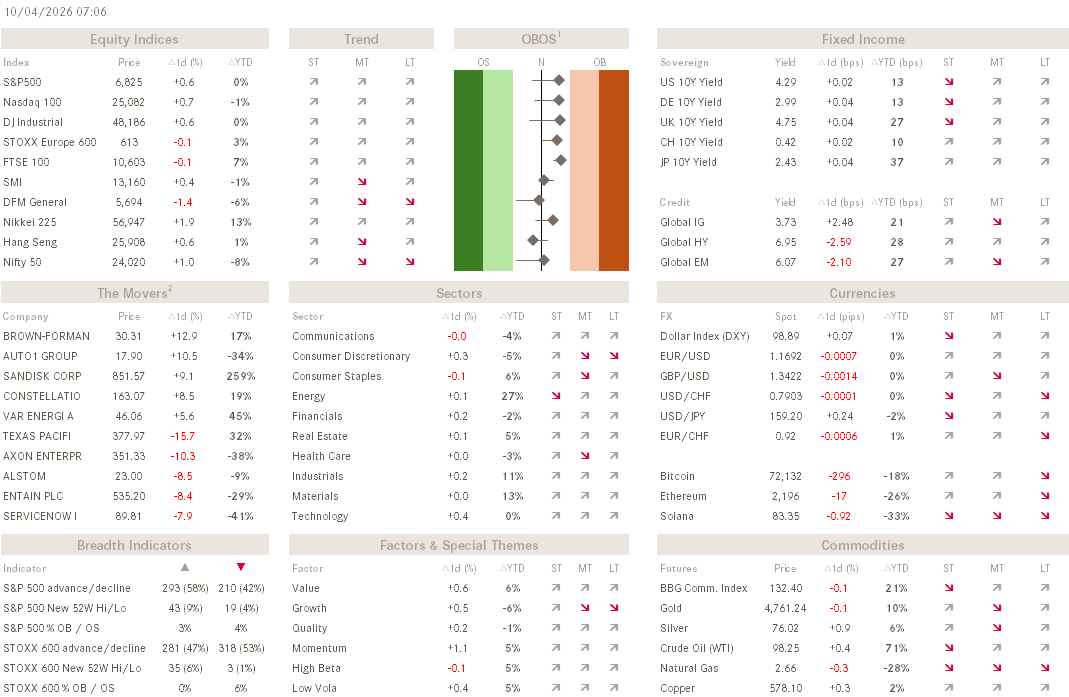
The Q - Daily Edition
Of Tops and Bottoms
“The stock market is the only place where things go on sale and everyone runs out of the store screaming.”
— unknown

** Housekeeping **
This week I have been bogged down writing the Q2 Asset Allocation and Investment Outlook together with the investment committee team. This always gargantuan task has kept me from publishing the weekly Quotedian and this will be the only daily one for this week. However, fret not, as you shall be compensated on Monday with a “sneak peek” preview of our quarterly outlook in the weekly Quotedian:
Thereafter we should be back on normal publishing schedule.

What’s up? What’s not up! Another week where we literally get calls for extinctions of an entire civilisation, followed by some heavy TACO eating…
Too much to cover it all in a supposedly short, daily edition, but let’s have a look at some key charts and ideas.
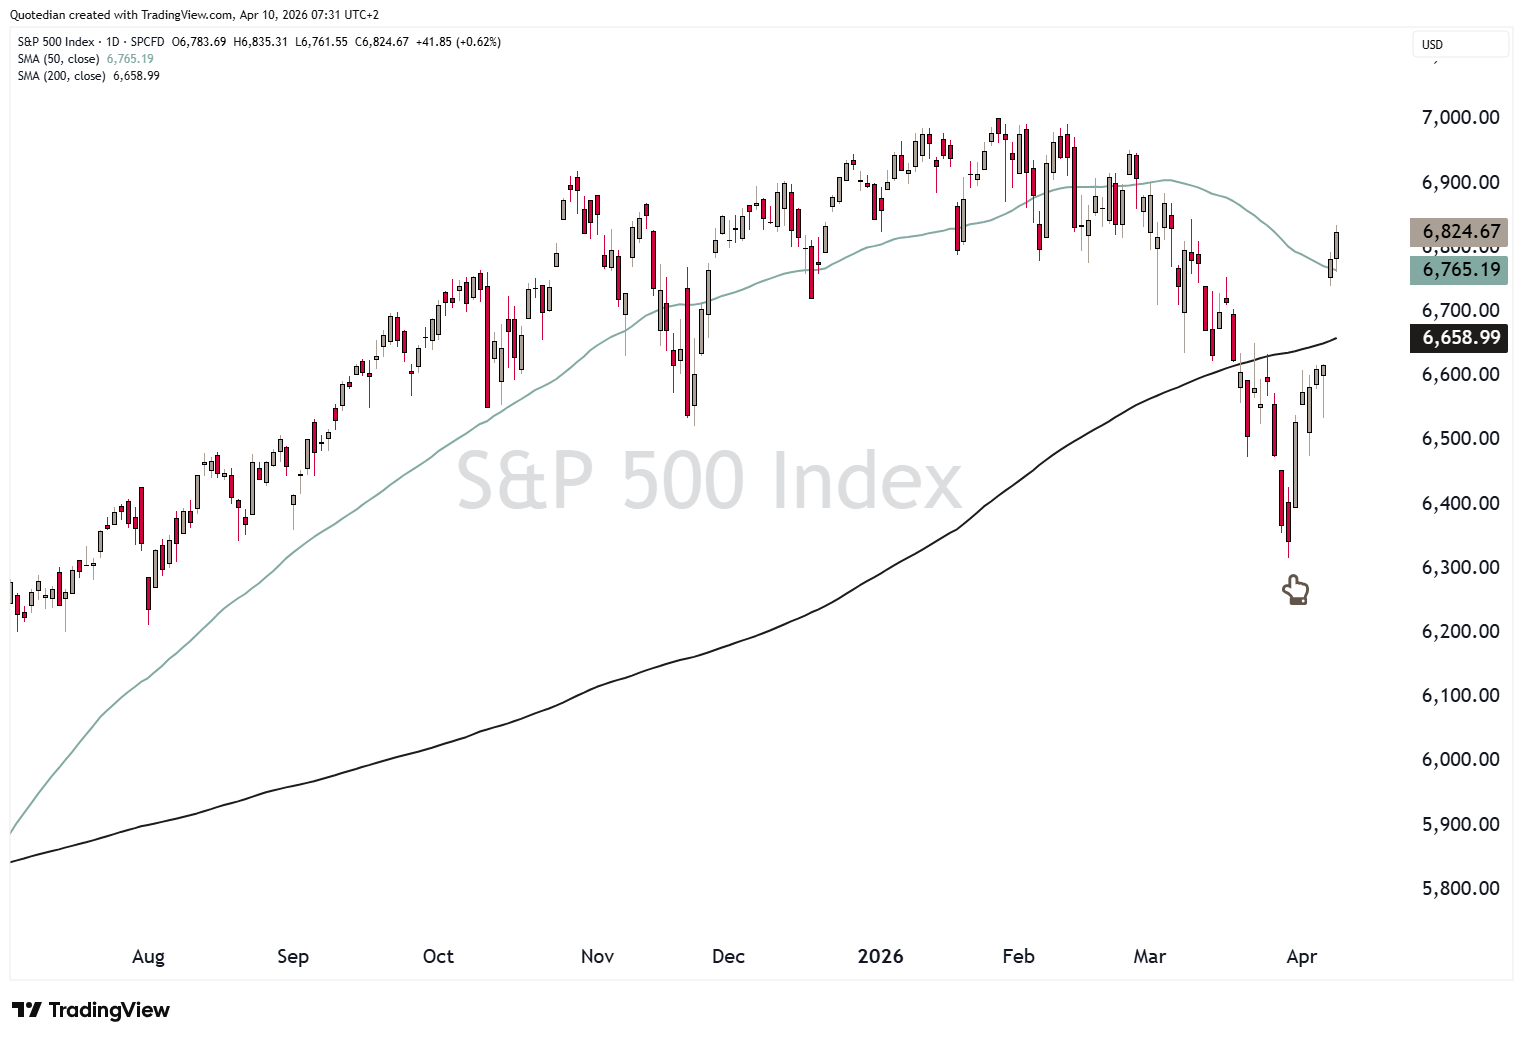
In equity markets, the S&P 500 has bottomed for the medium-term on Monday a week ago (30.3.) and with the price now firmly back above the 200-day AND the 50-day moving average, chances for reaching a new ATH in the near future have increased:
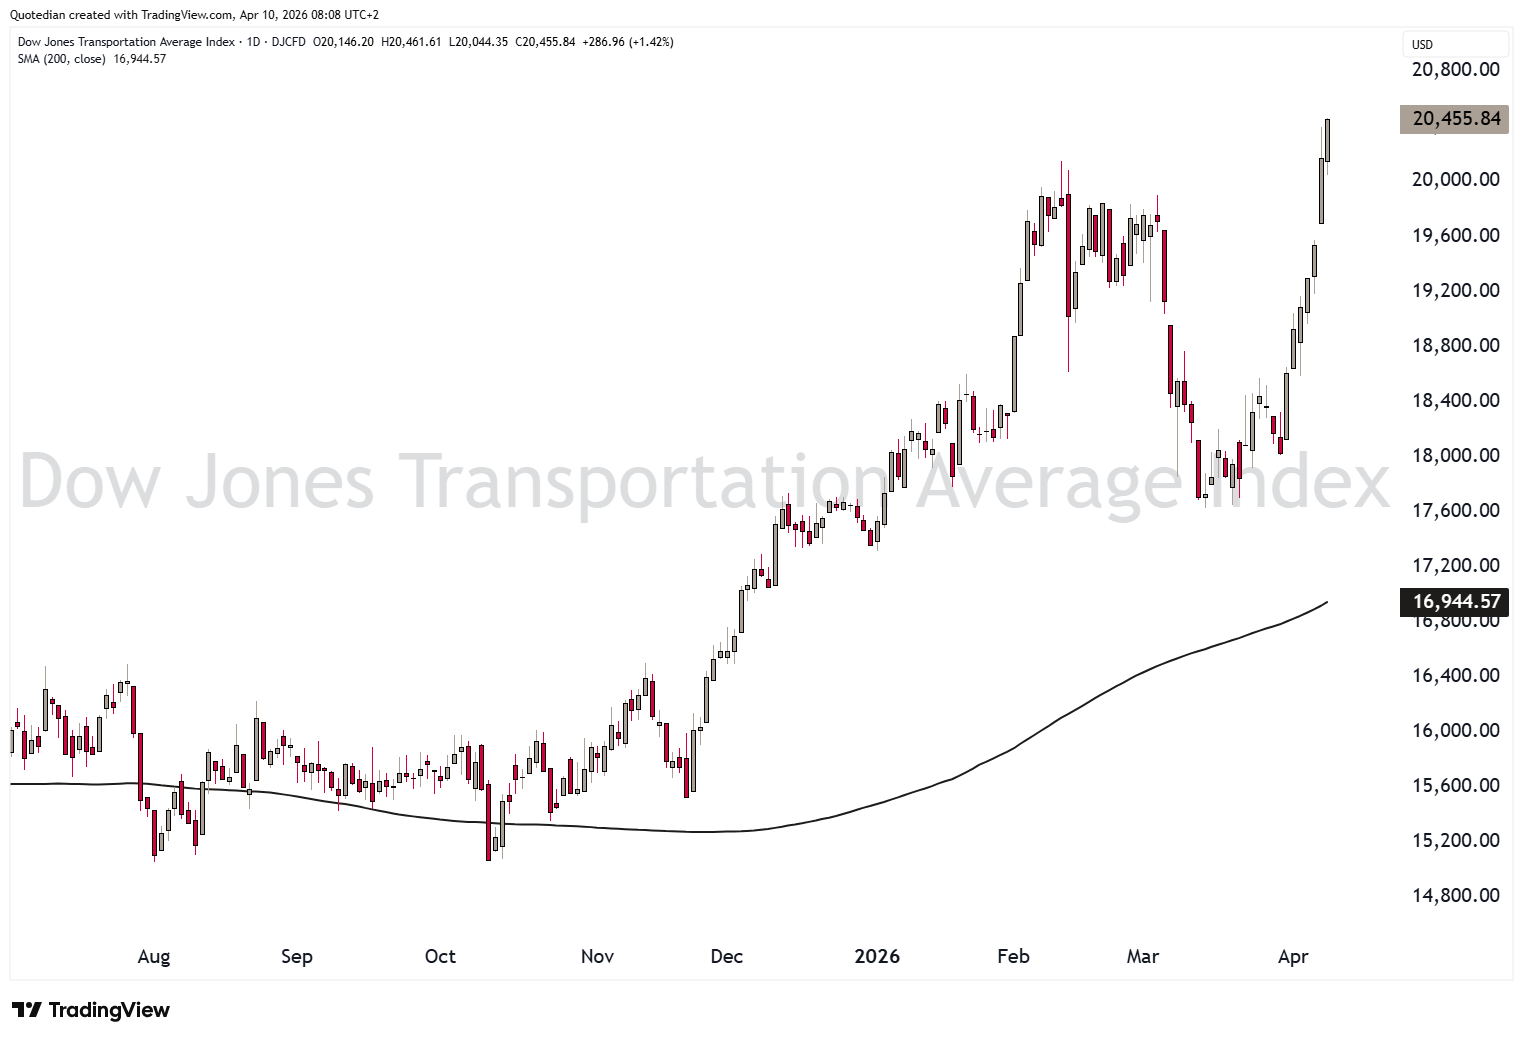
Giving additional confidence that the major indices could be hitting new all-time highs (ATH) soon, is that more cyclical measures, such as the DJ Transport index,
or the Philadelphia Semiconductor index,
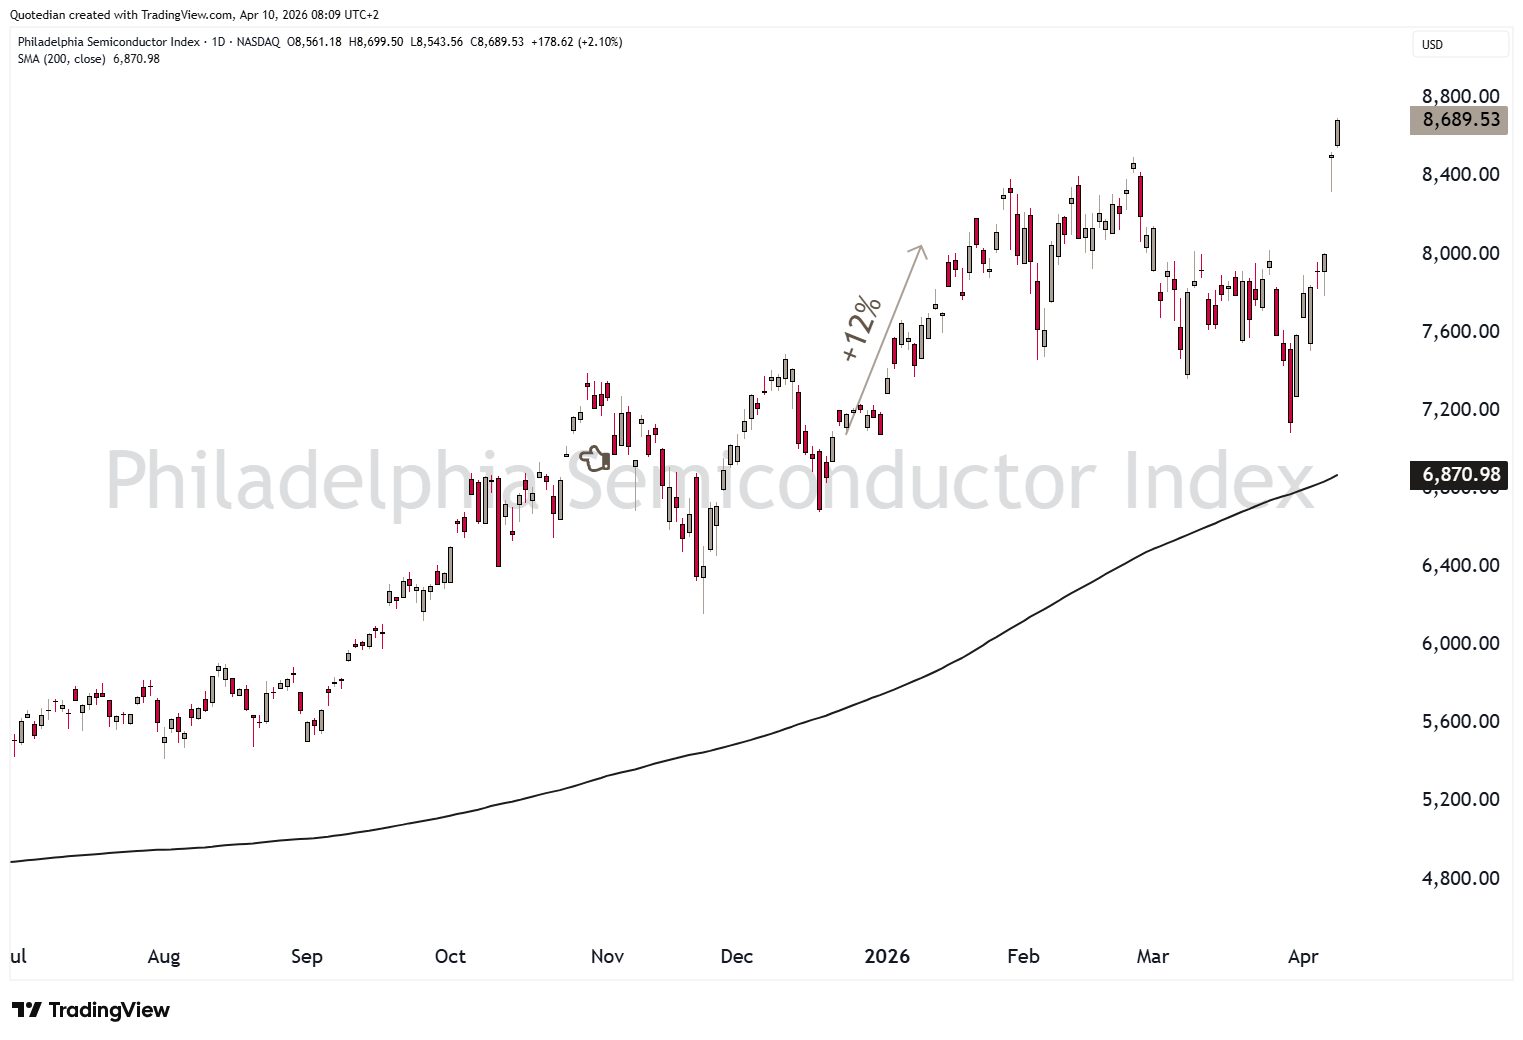
have already done so!
However, with earnings season starting next week,
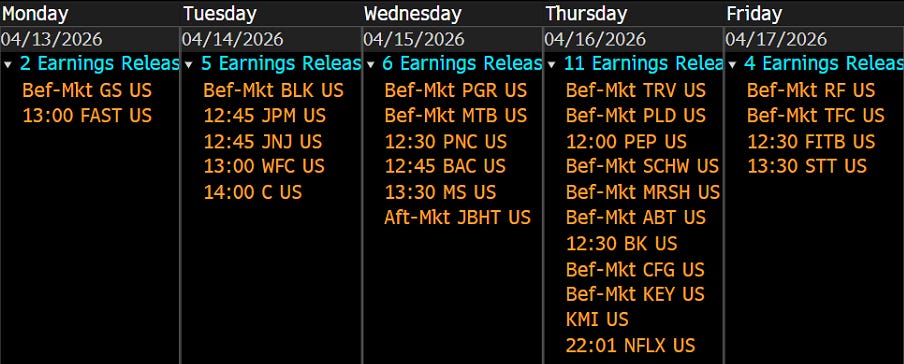
it will be important to see whether CFOs will downgrade their guidance. Analysts have not yet done so (next 12 month earnings estimates, red line),
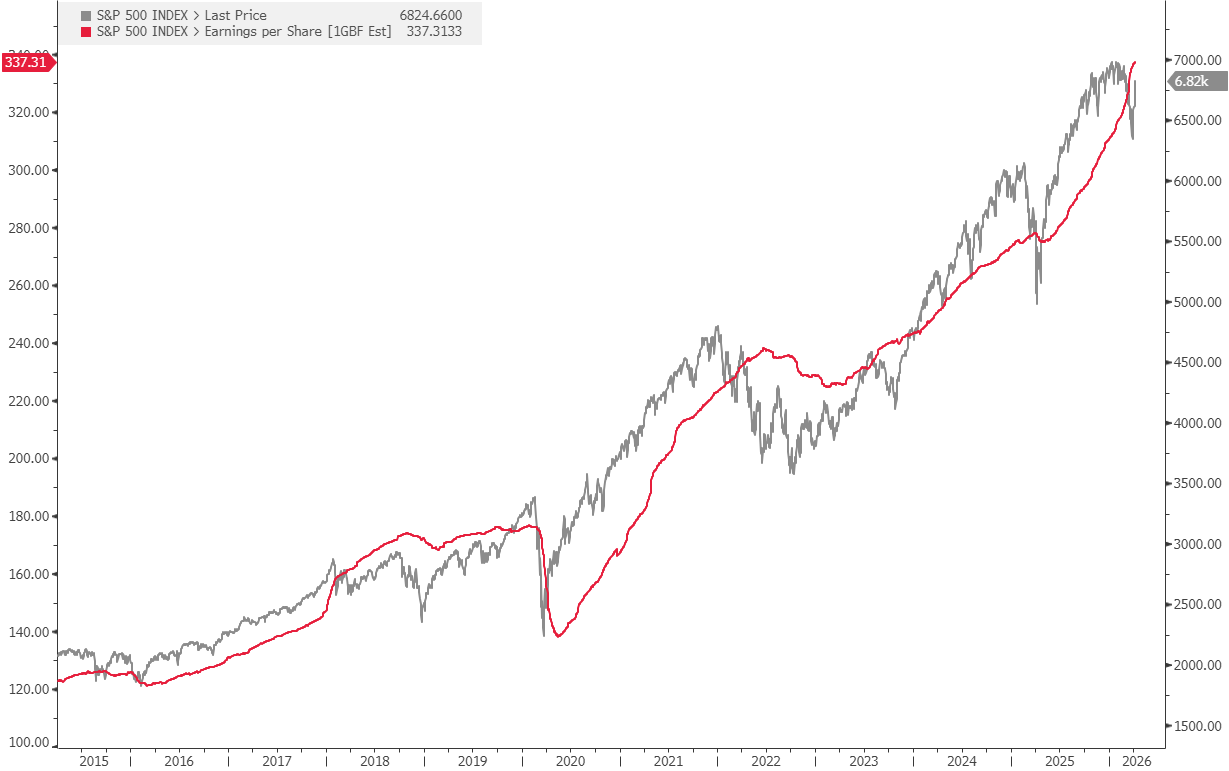
which could lead to major disappointment.
Mildly surprising, European stocks (SXXP) bottomed out a week earlier (23.3.) than their US peers:
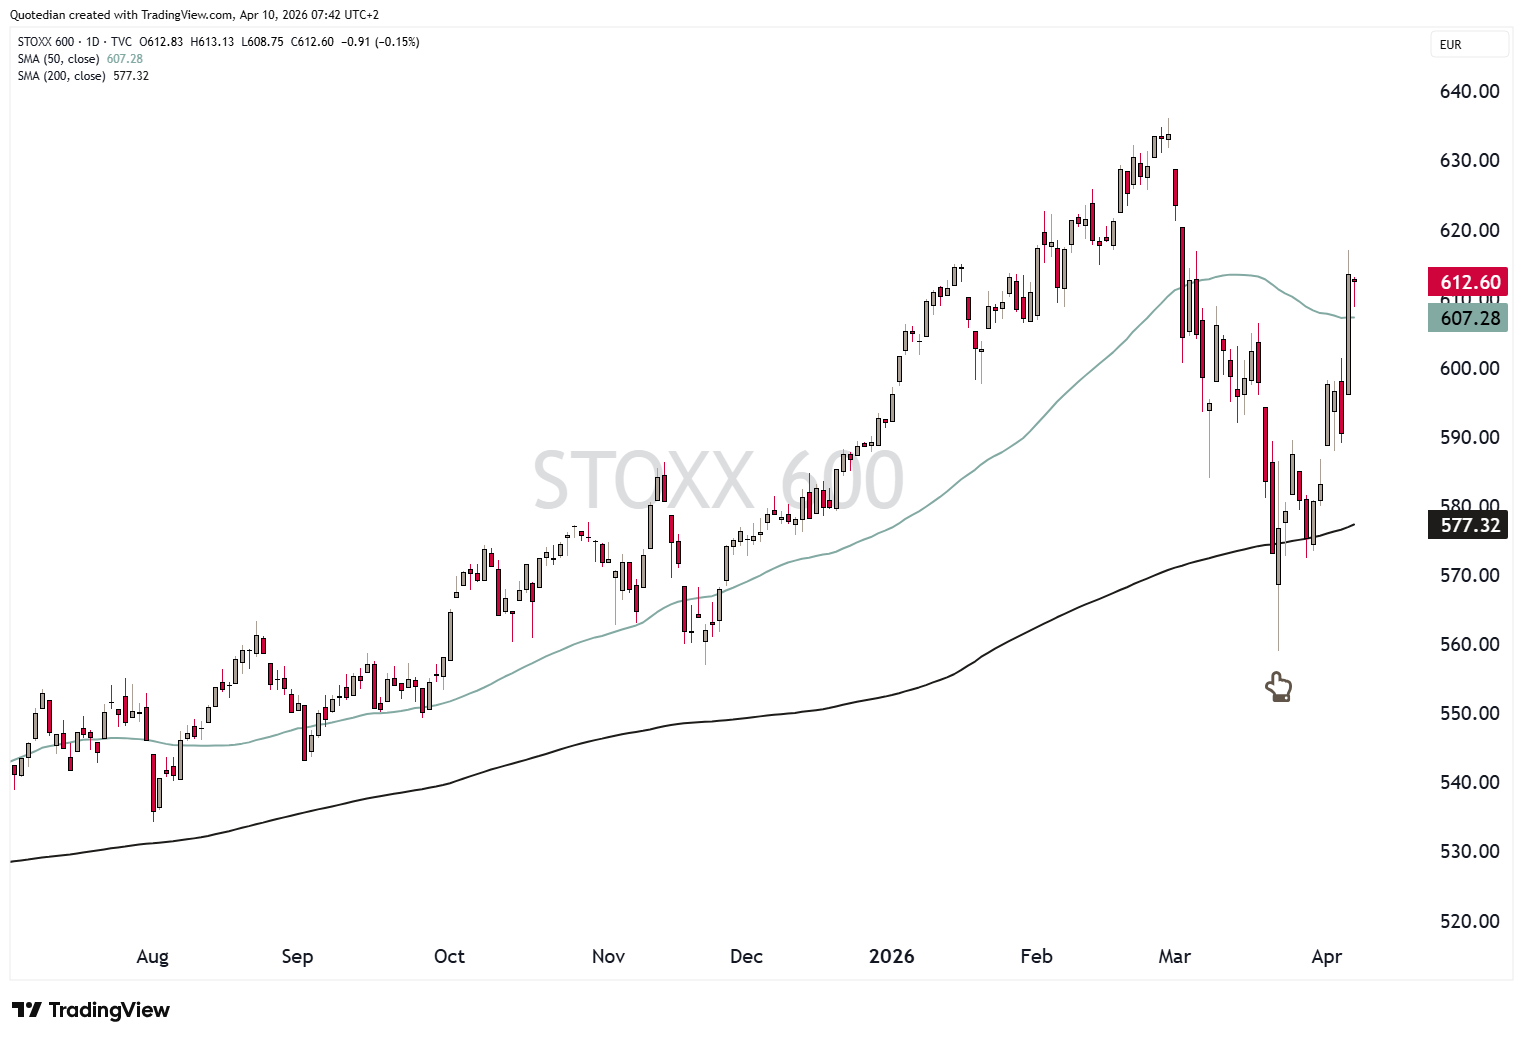
And, noteworthy, did this index never close below its 200-day moving average.
Bond yields (below the US 10-year Treasury version) topped out simultaneously out with the bottom in stocks, which is no surprise, as the entire market has been trading the headlines over the past few weeks as one enormous macro trade:
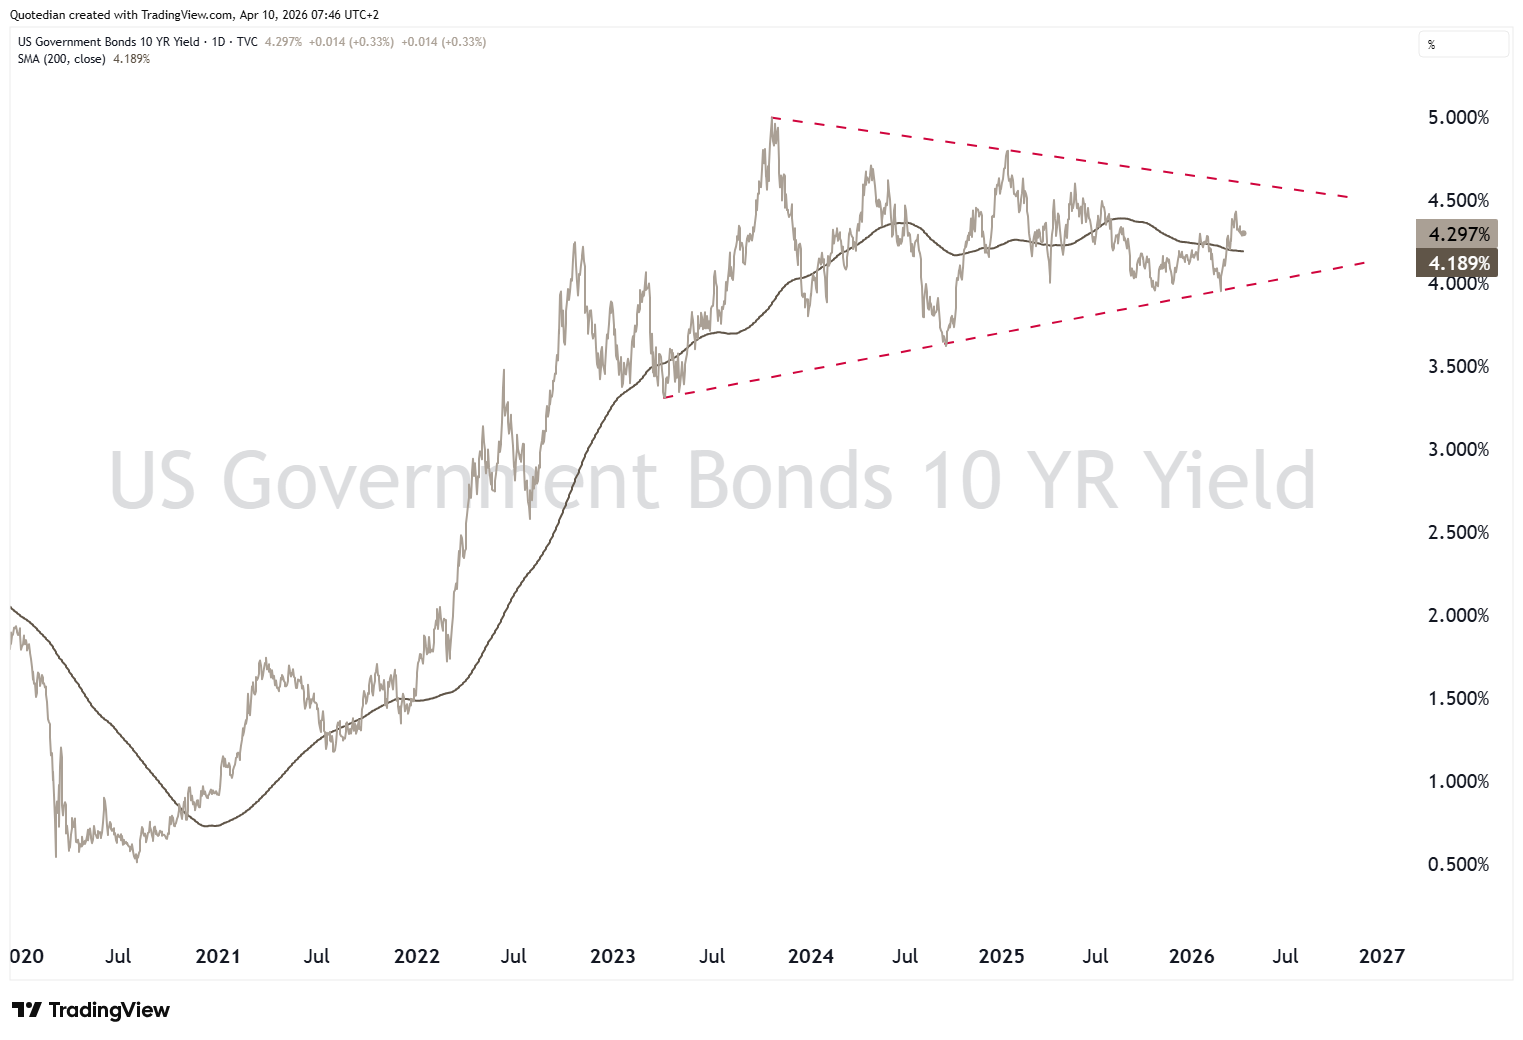
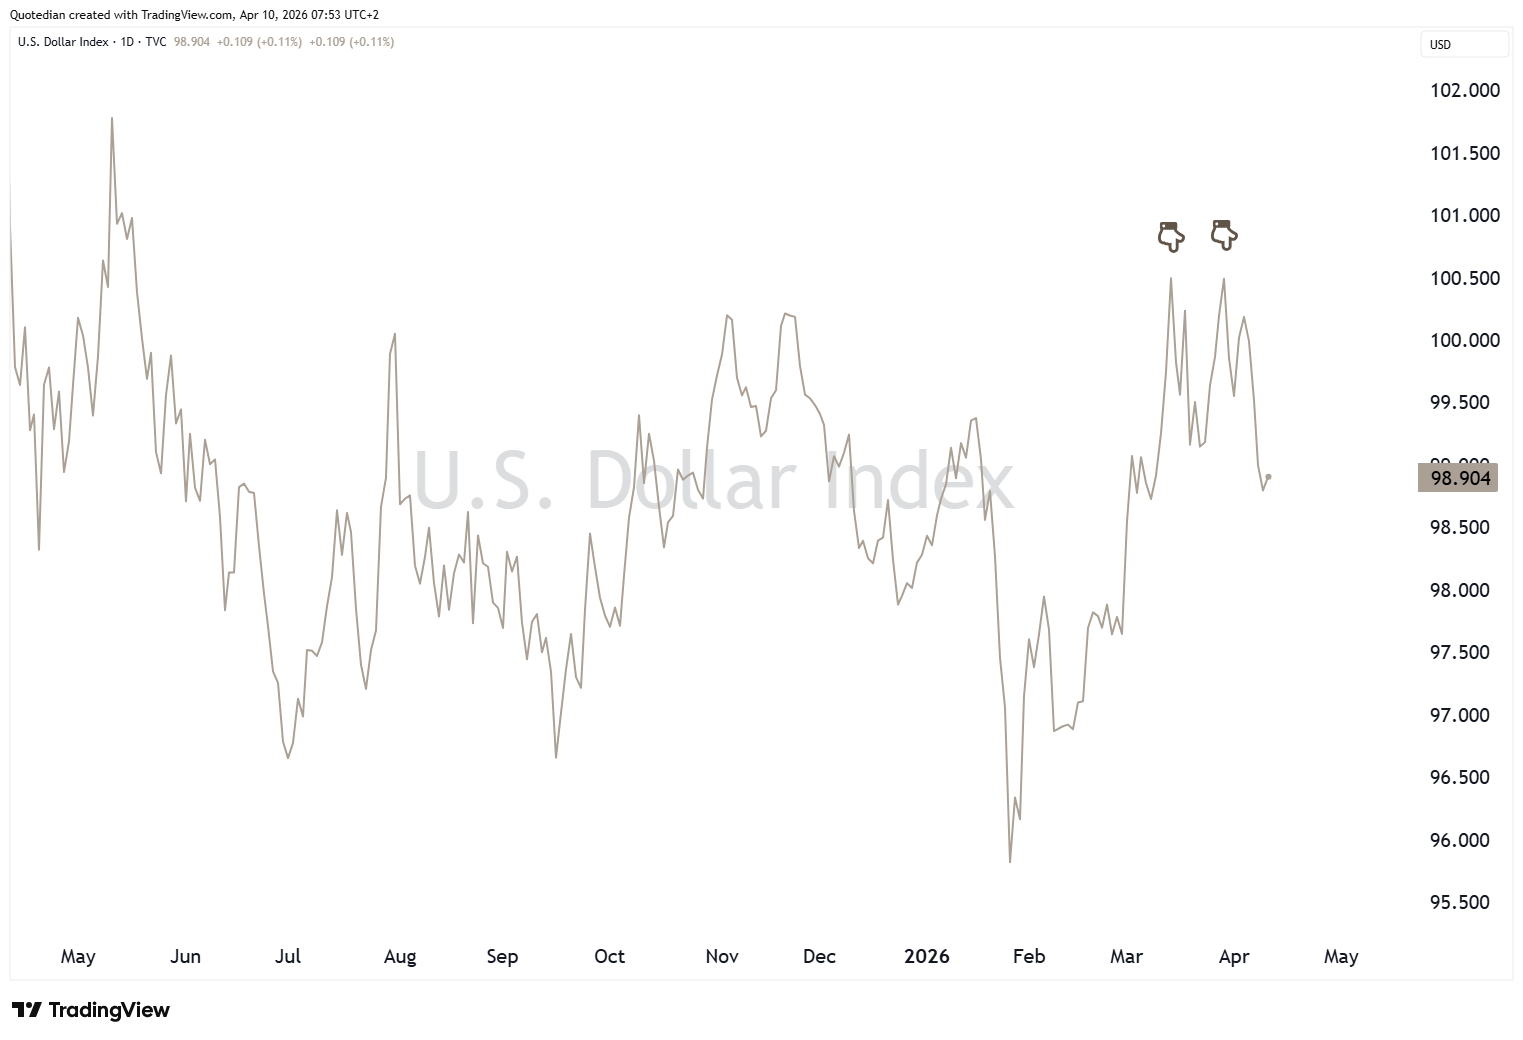
It follows then, that if stocks bottomed and bond yields topped, the US Dollar now should also have topped out,
and so should have the oil price (Brent):
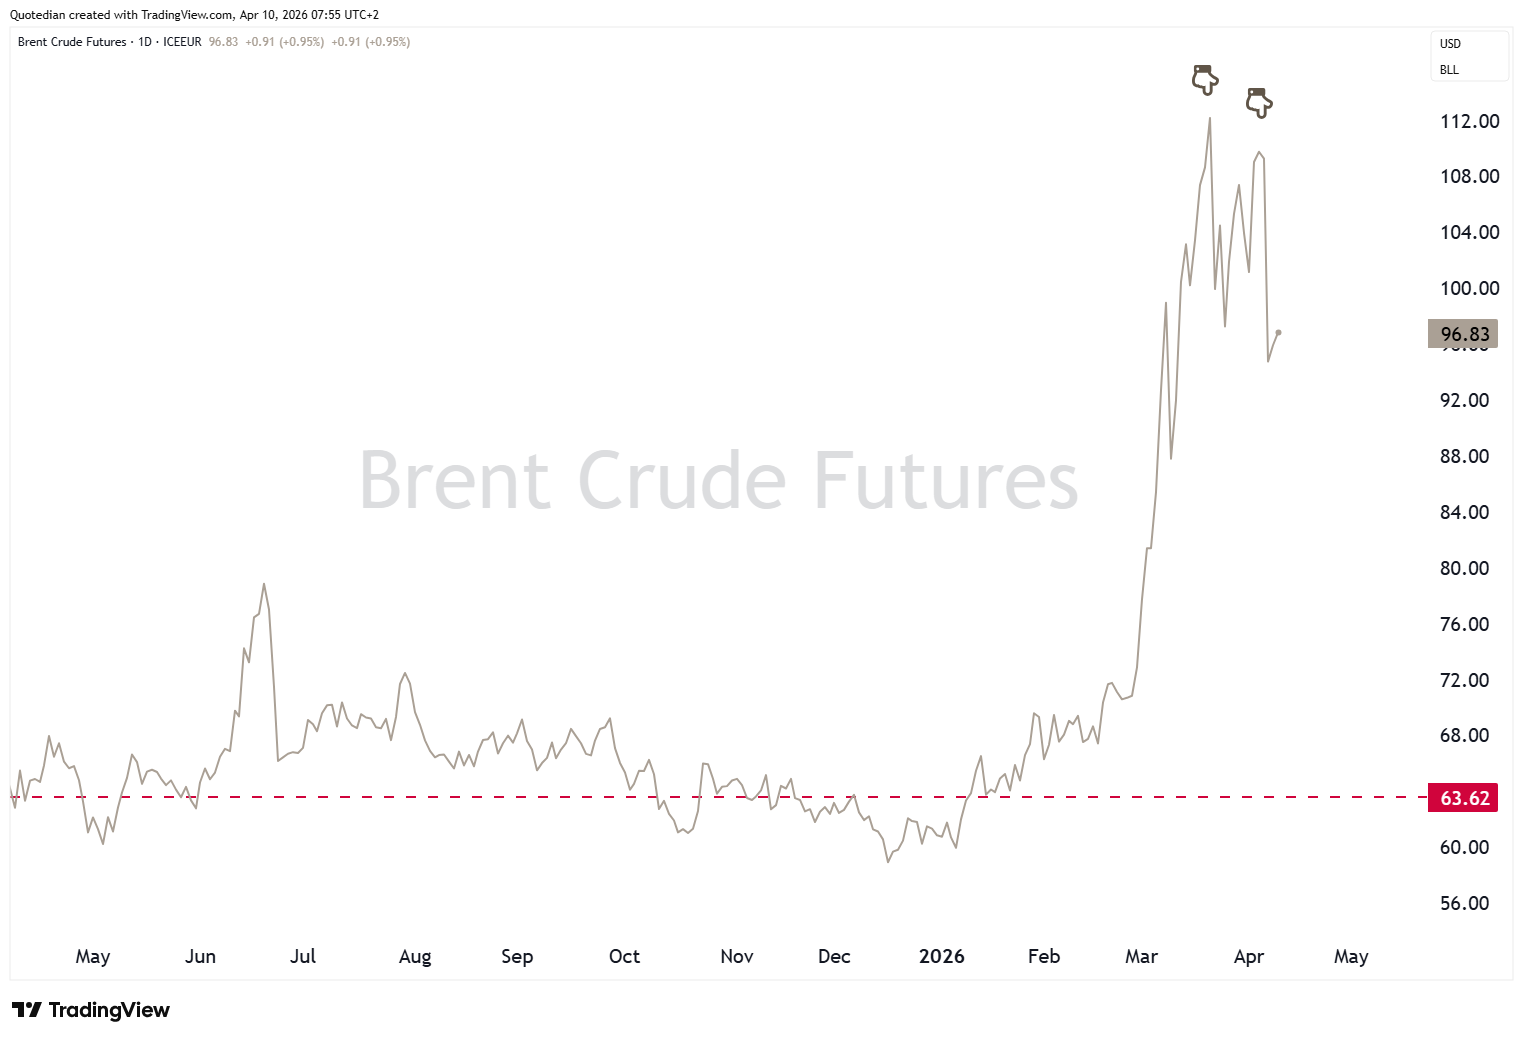
BINGO on both accounts!
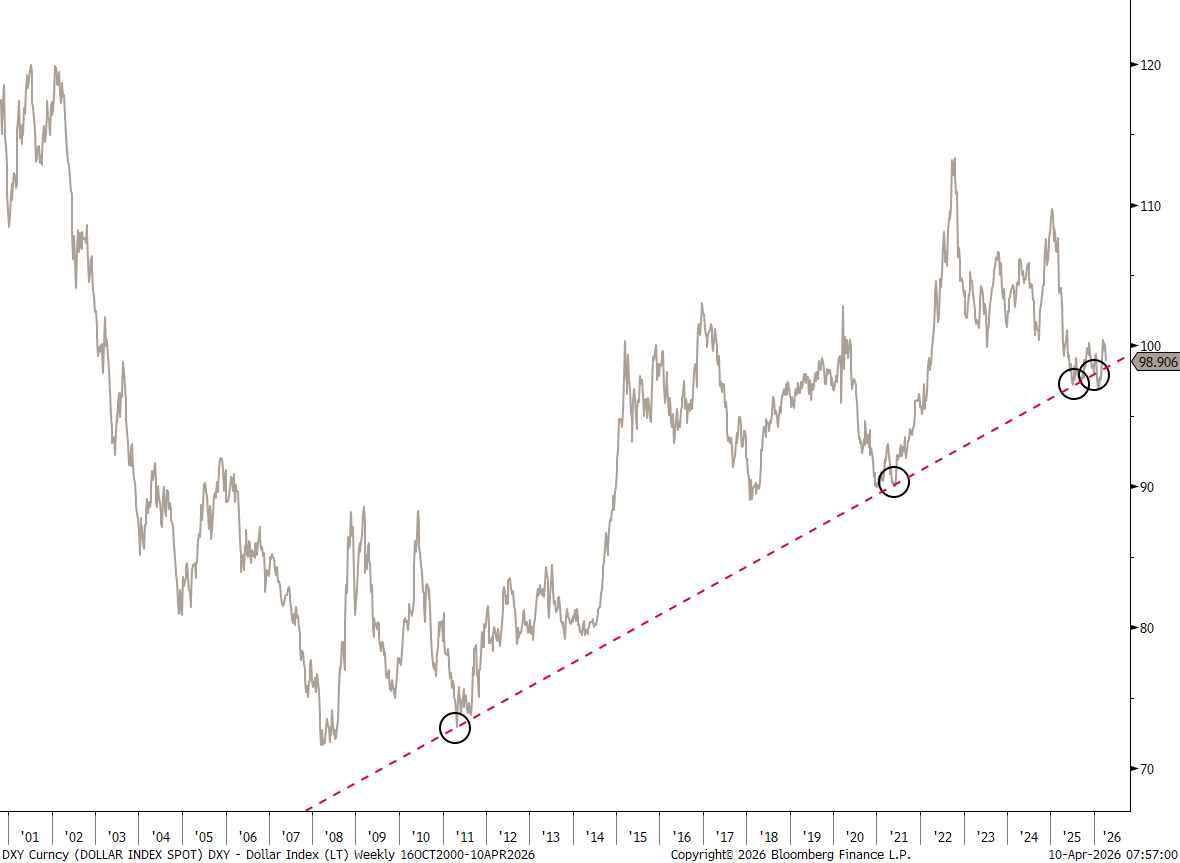
Rapidly back to the greenback though, where the lack of true strength during this major geopolitical crisis confirms our view that more secular weakness lies ahead. We are watching that red dashed line on the Dollar Index (DXY) chart very closely:
Gold (and silver) had been trading with a high positive correlation (R2 0.50 as compared to 5-year average R2 0.02) to stocks during all this Middle East mess, proving it was a liquidity provider after the massive rally over the past few years. We still see gold higher over the next few weeks:
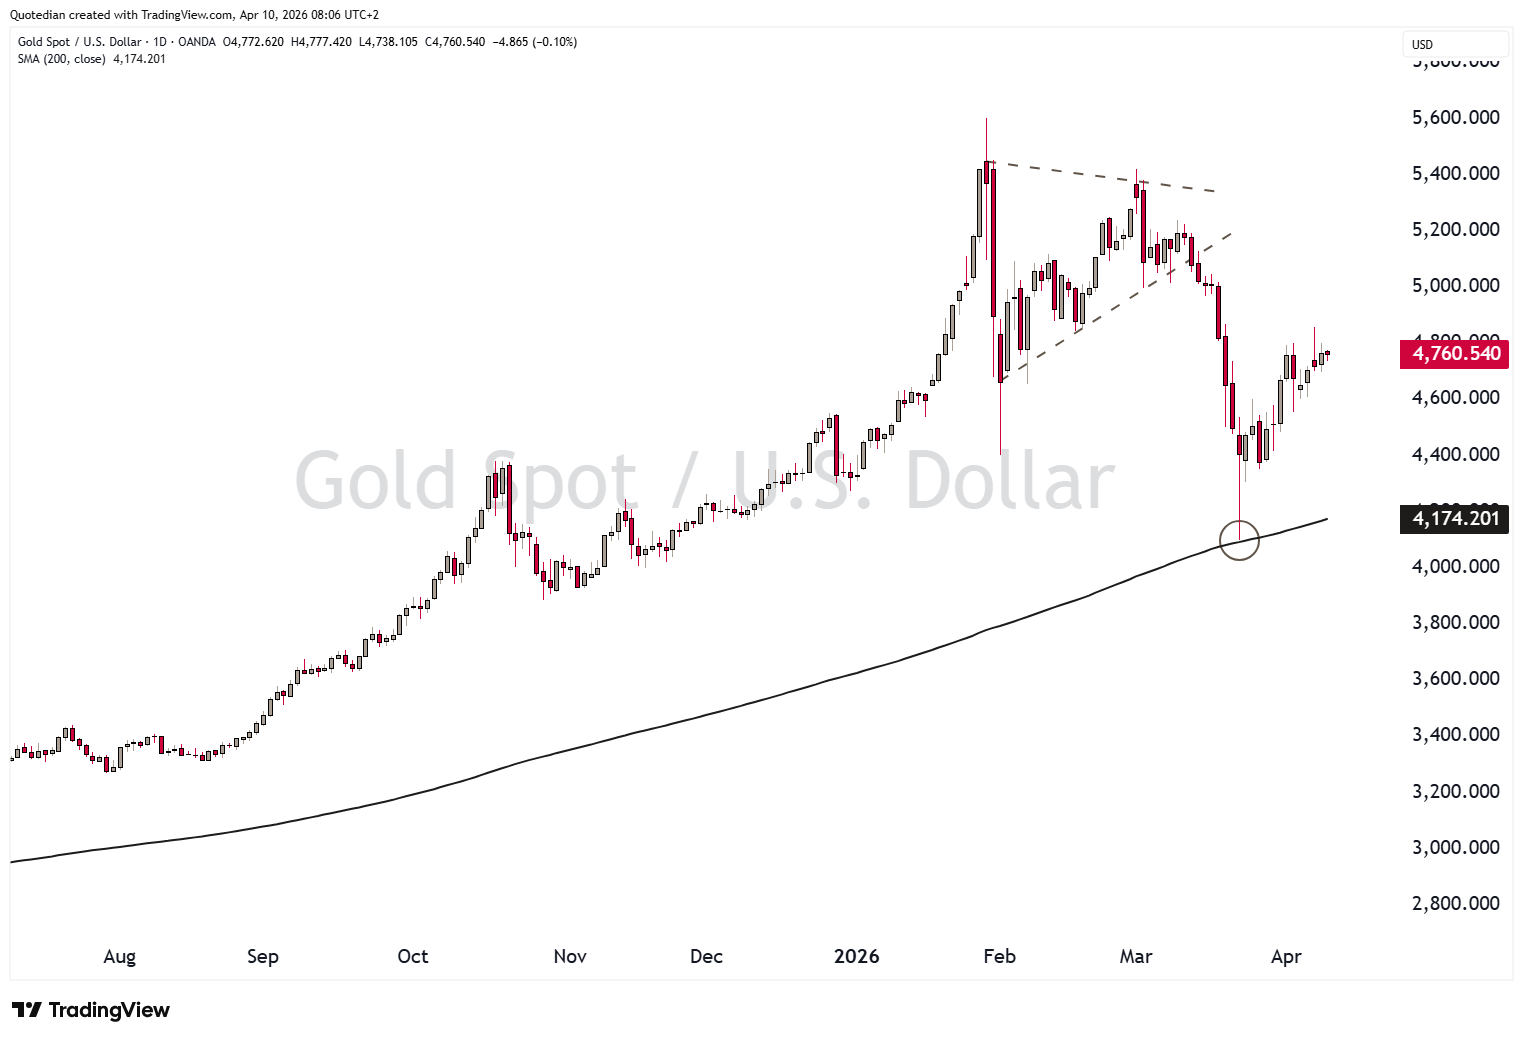
A special mention goes to that “touch ‘n go” on the 200-day moving average!

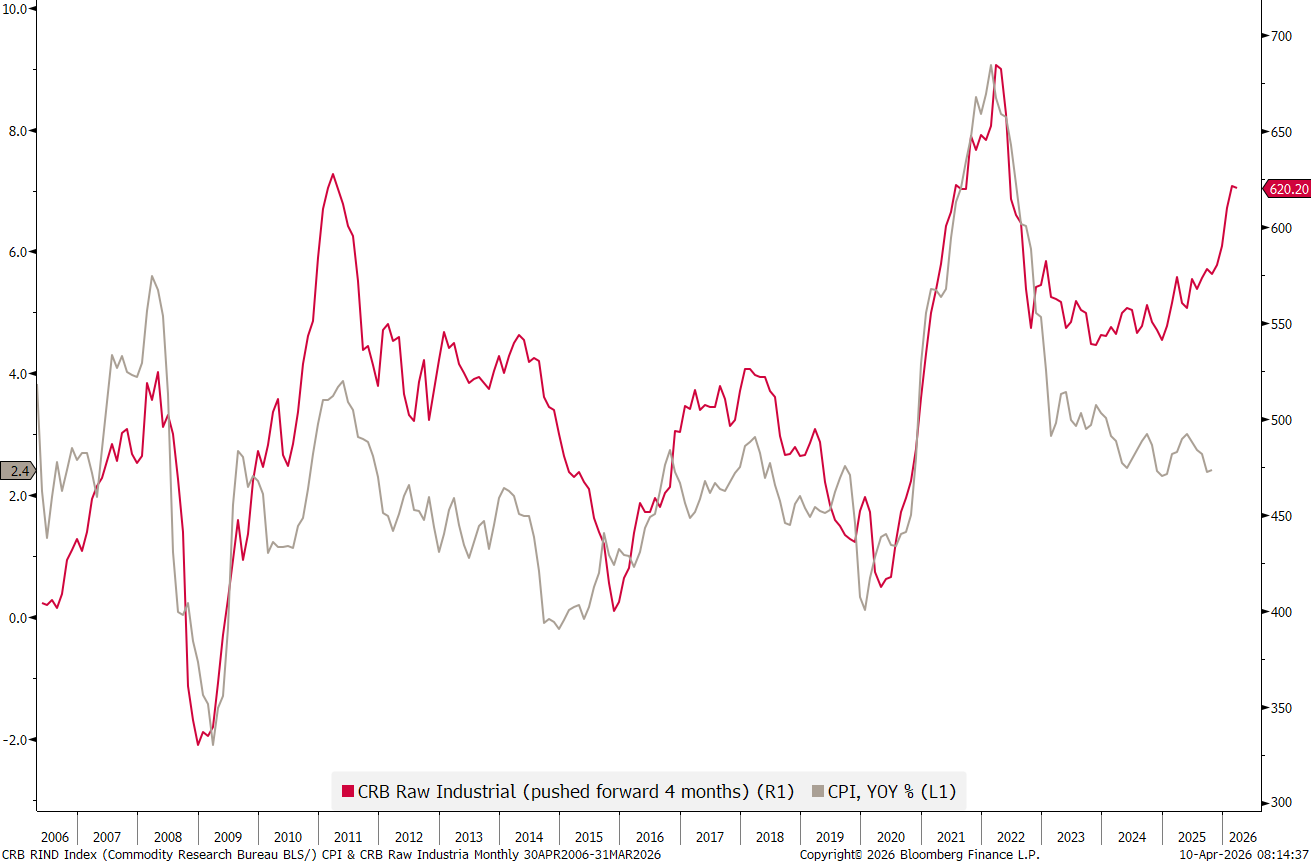
Later today we will see the release of inflation (CPI) data in the US. Regular readers already know how much I detest this lagging and manipulated number, but still, it will be one that the market looks at for impact of this recent Strait of Hormuz (SoH) crisis. Well, here is what I think they can await over the coming months:
We have more charts with similar path-predictions in our upcoming Q2 outlook.

CPI will be the focus, but there are also Sentiment, Durable Goods orders and some Federal Budget numbers being reported later this (European) afternoon.
Other than that, fade the headlines and stay safe!
Have a great weekend everyone and, of course, May the Trend be with You!

Everything in this document is for educational purposes only (FEPO)
Nothing in this document should be considered investment advice
Investing real money can be costly; don’t do stupid shit
Leave politics at the door—markets don’t care.
Past performance is hopefully no indication of future performance
The views expressed in this document may differ from the views published by NPB Neue Privat Bank AG