

The Q - Daily Edition
April Fools' Day
"There are two ways to be fooled. One is to believe what isn't true; the other is to refuse to believe what is true."
— Søren Kierkegaard

Interesting times … as it has been for the past 15 months or so …
There we wrote on Monday in the weekly edition of the Quotedian how much (equity) markets were on the brink of breaking down and negative global growth taste in our mouths we had not had for … well, about a year since Liberation Day.
Moving on 48 hours, and the charts look pretty constructive again after a massive rally on Tuesday. And this under a scenario that very much reminds me, as I have been discussing with colleagues, of the Eagles classic “Hotel California” song (click here), as Trump is willed to clear victory on Iran, even if the Strait of Hormuz remains closed…
Last thing I remember
I was running for the door
I had to find the passage back
To the place I was before
"Relax, " said the night man
"We are programmed to receive
You can check out any time you like
But you can never leave"
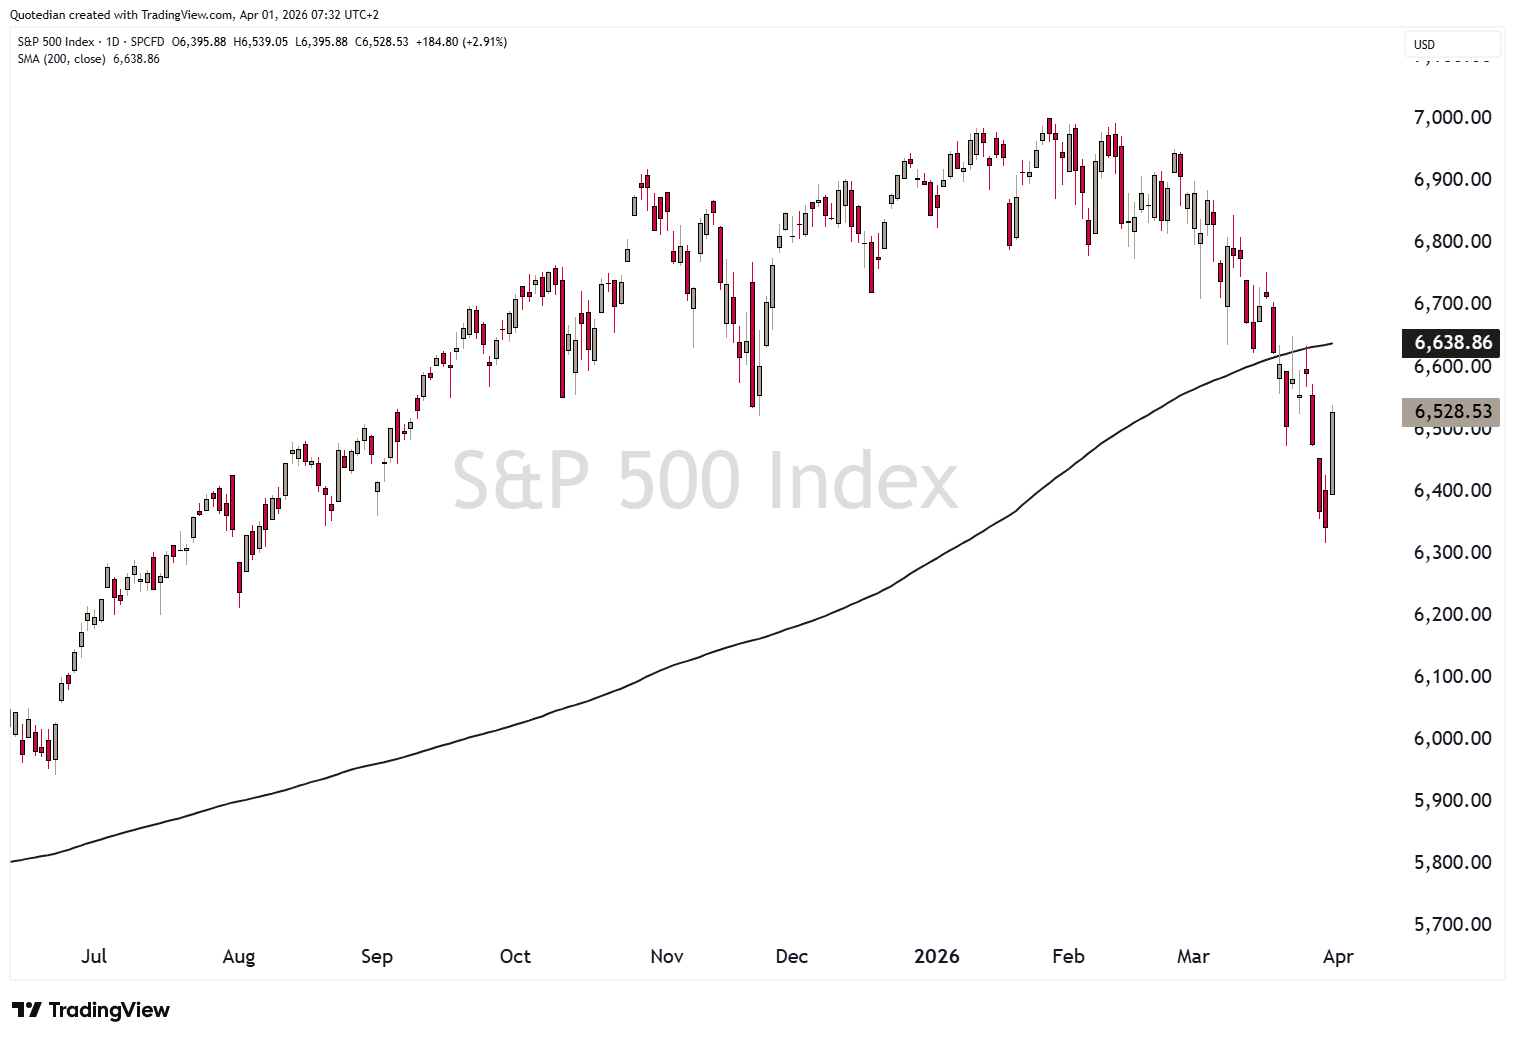
Mind you, despite a nearly 3% rally it has been a dreadful month, not only for the S&P 500,
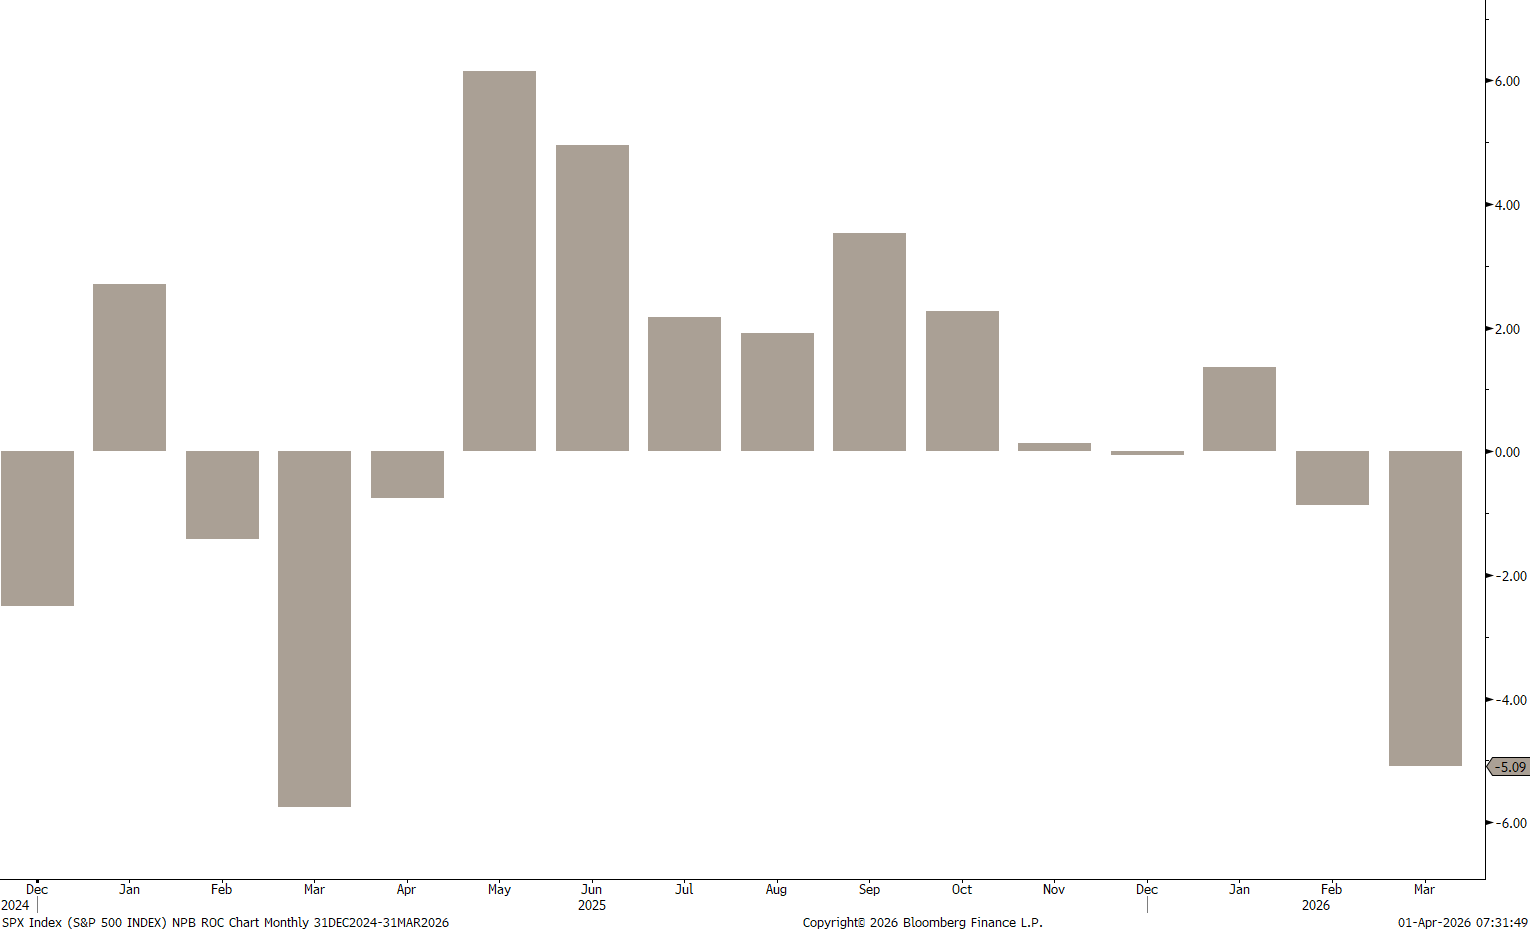
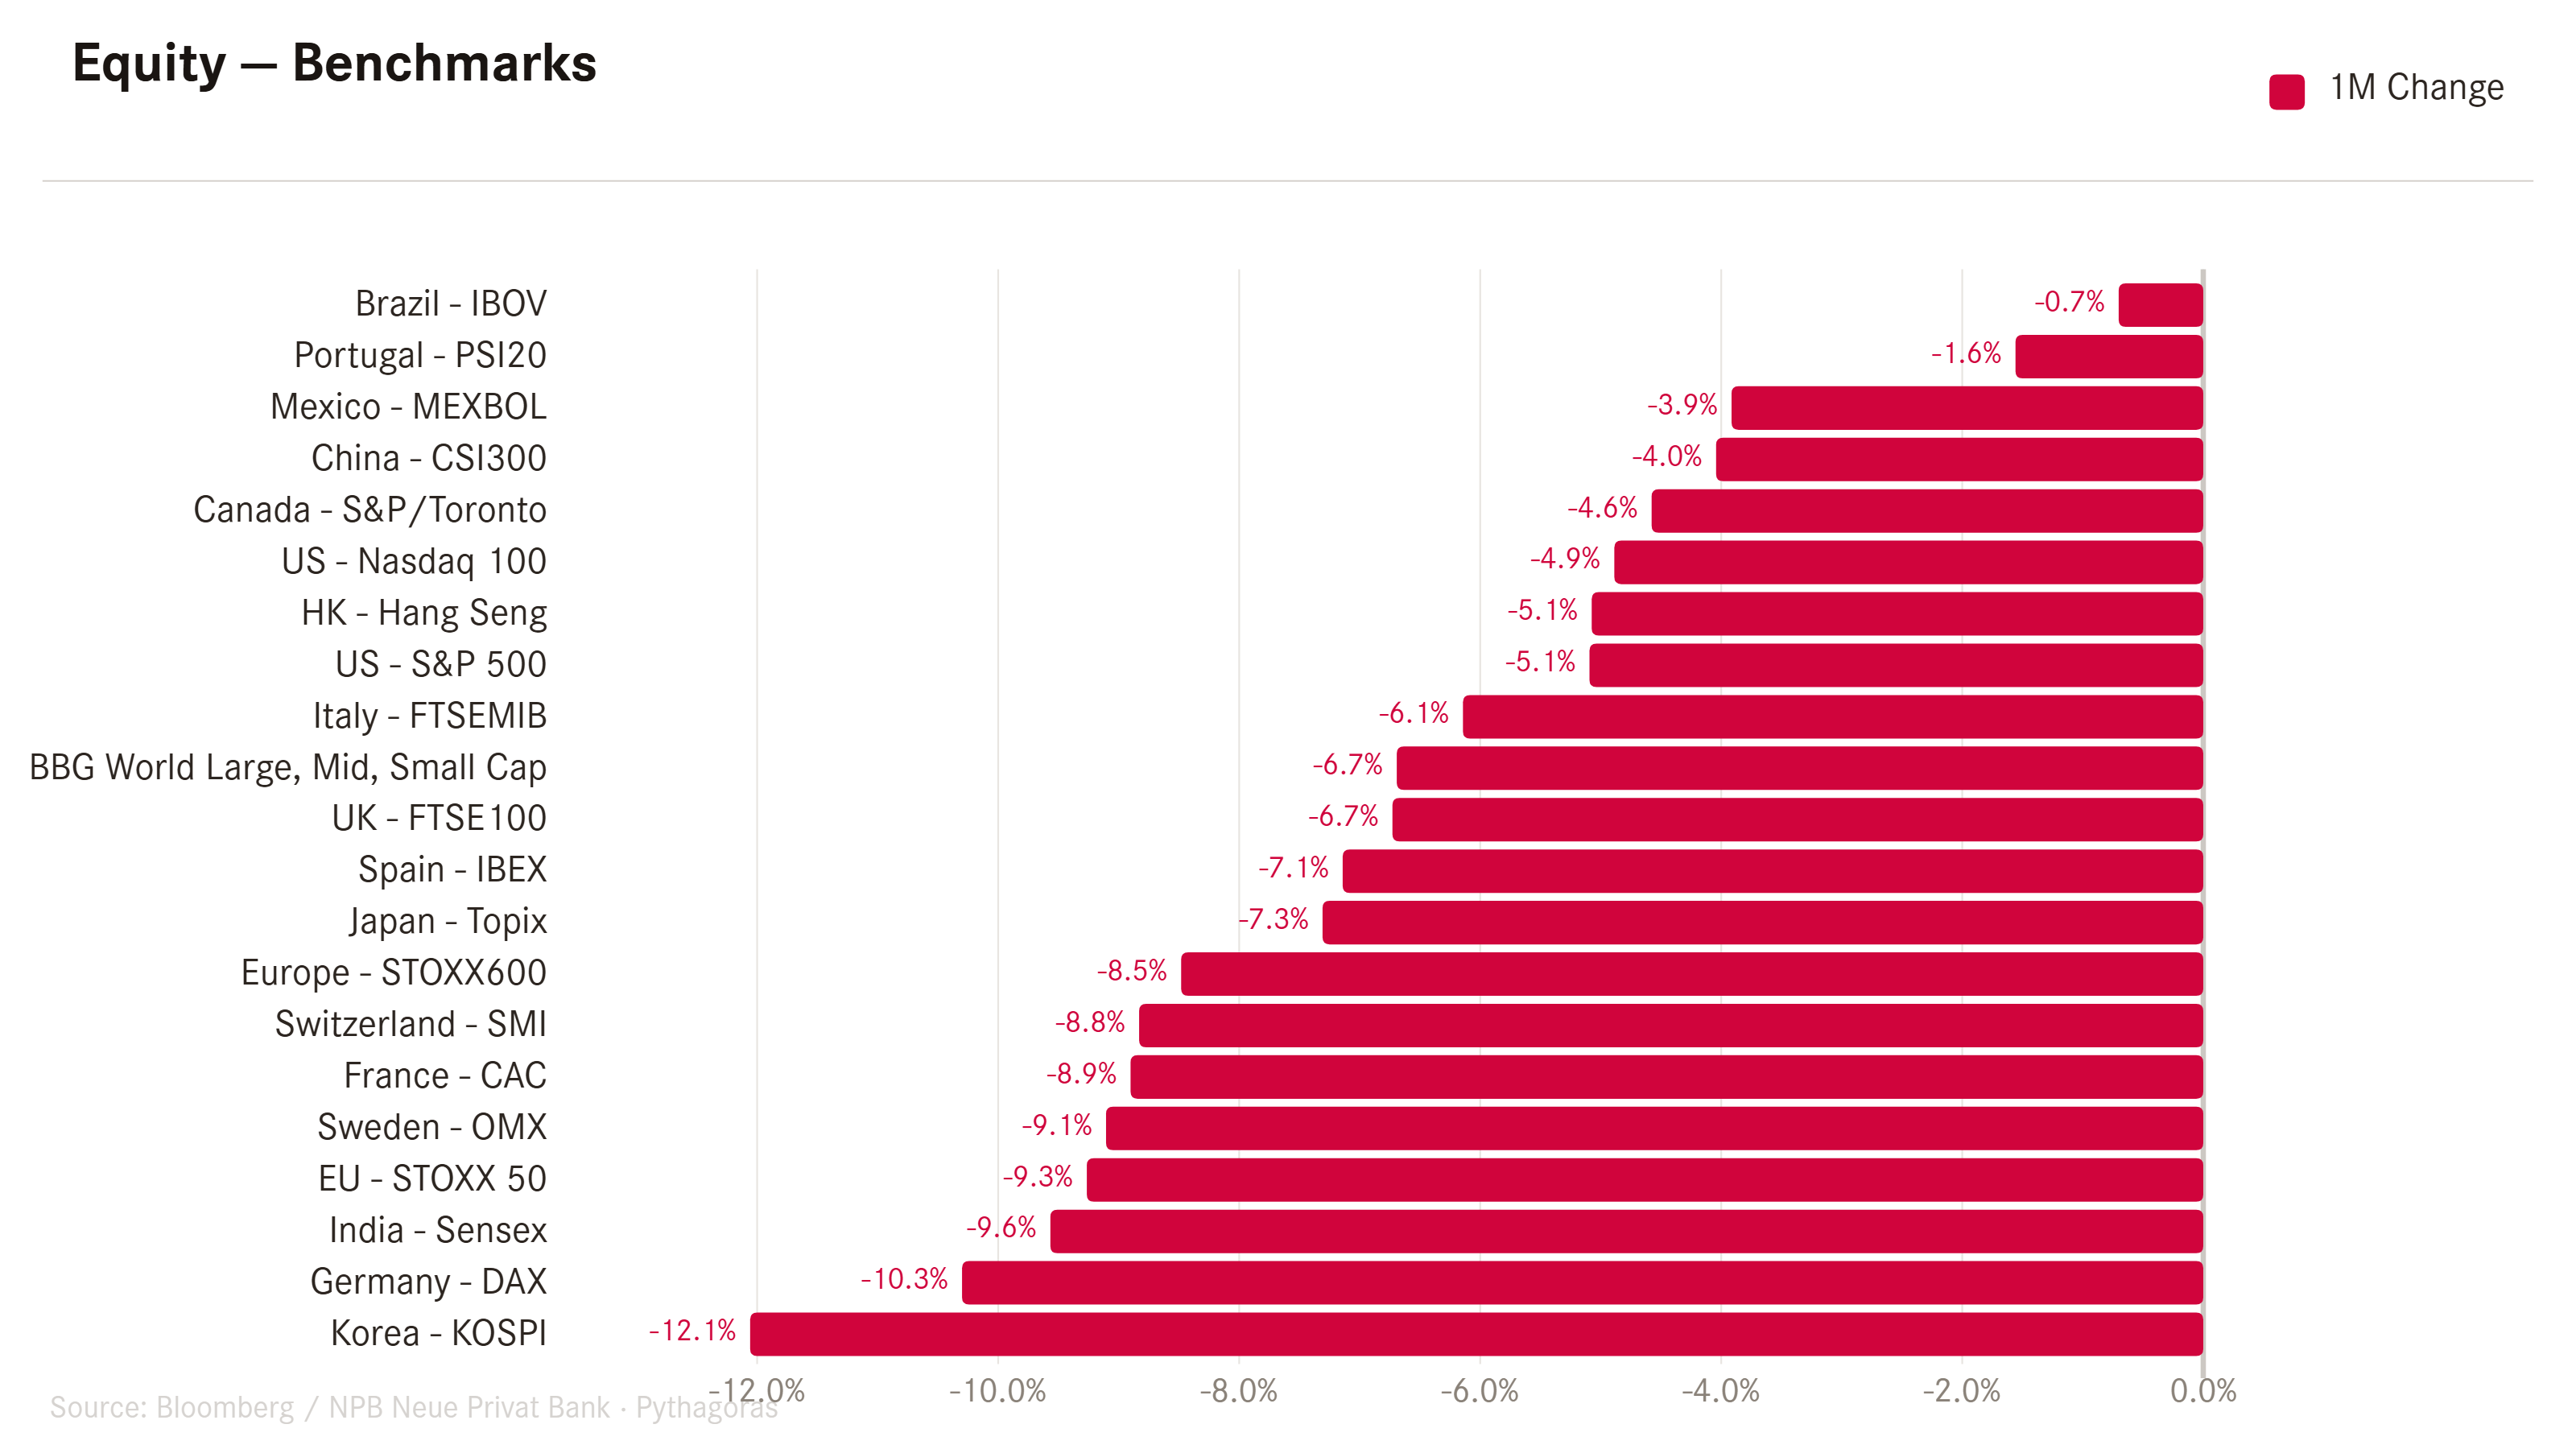
where it had been the worst month since, well, last March, but also for global key benchmark indices in general:
On the chart, and as forementioned, the yesterday’s rally has helped improve the ‘visual aspect’ of the overall picture, however, it must be noted that we still trade below the 200-day moving average on the S&P 500 and the Nasdaq 100 (not shown):
And immediately following having said that, the S&P 500 equal-weight index managed to close above the key landmark (the 200-day MA that is), after just two closes below it, which has very bullish interpretation potential:
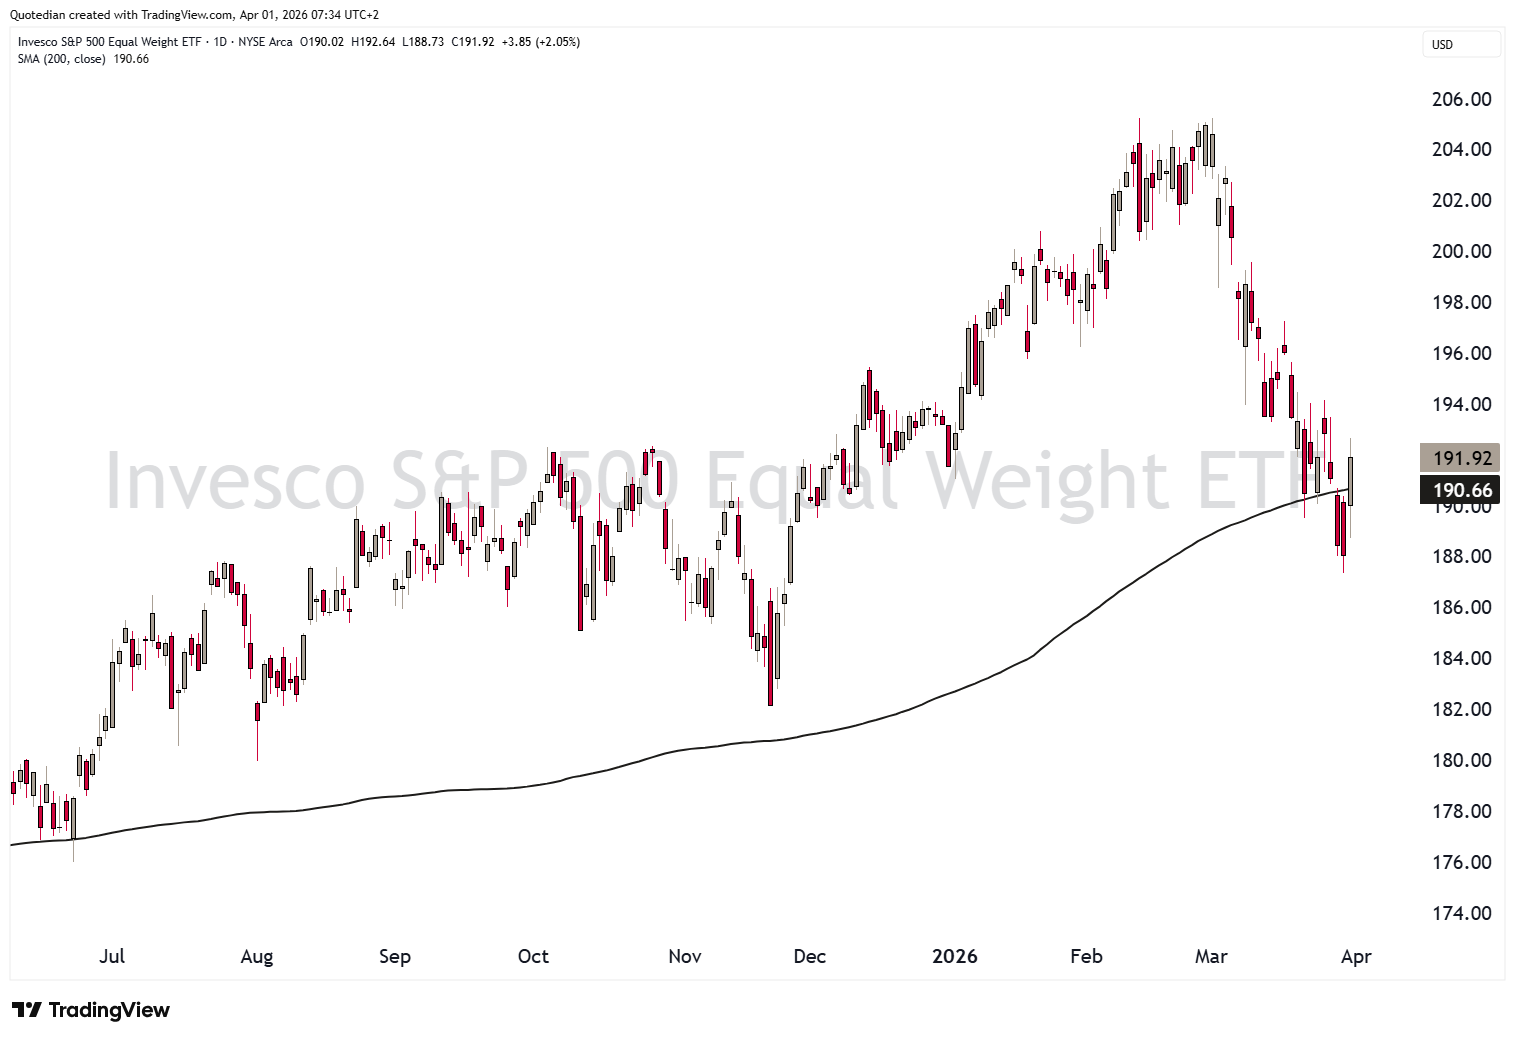
It is also a hint to how broad yesterday’s rally was, with an advance-decline ratio of larger than 5:1
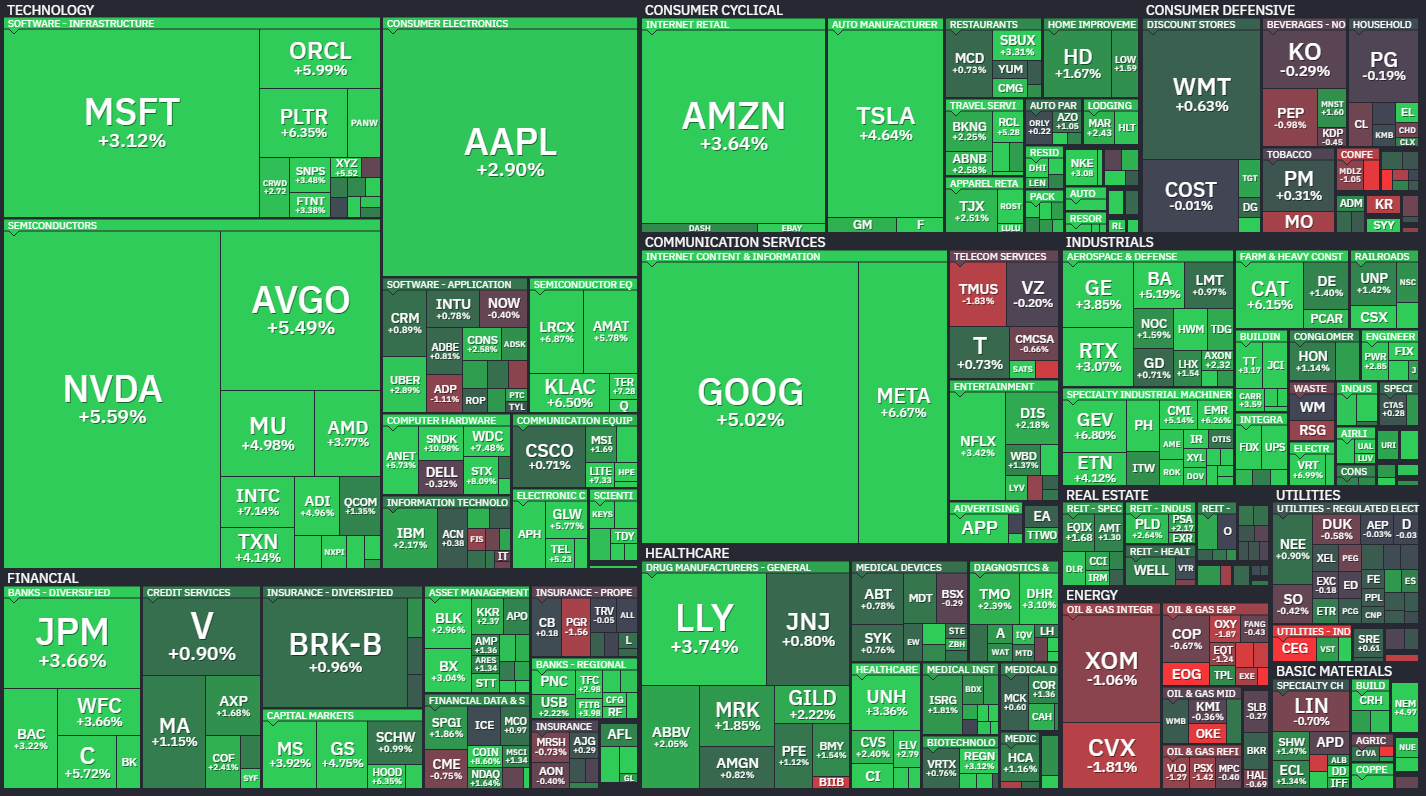
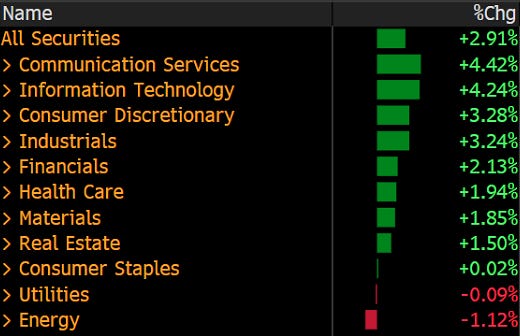
There was really only one sector (with the allowance of utilities) printing proper red yesterday, which was, unsurprisingly so, the energy sector:
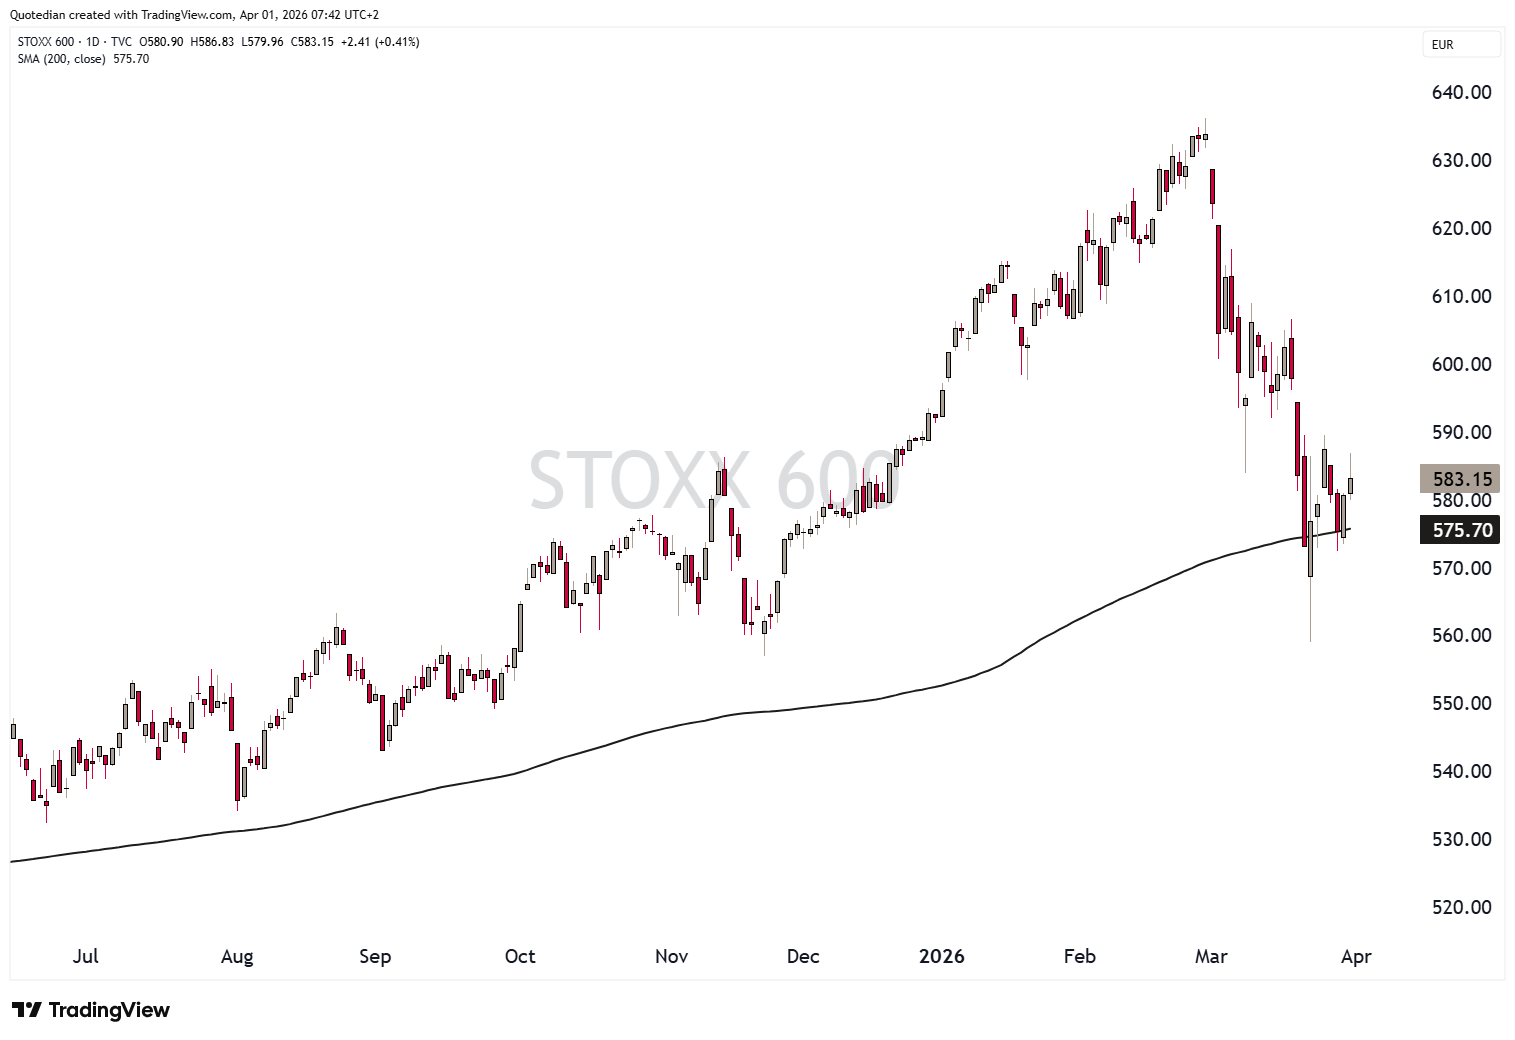
European stocks, maybe to the surprise of most of us, actually have one of the most favourable chart pictures, with the STOXX 600 never having closed below its 200-day MA:
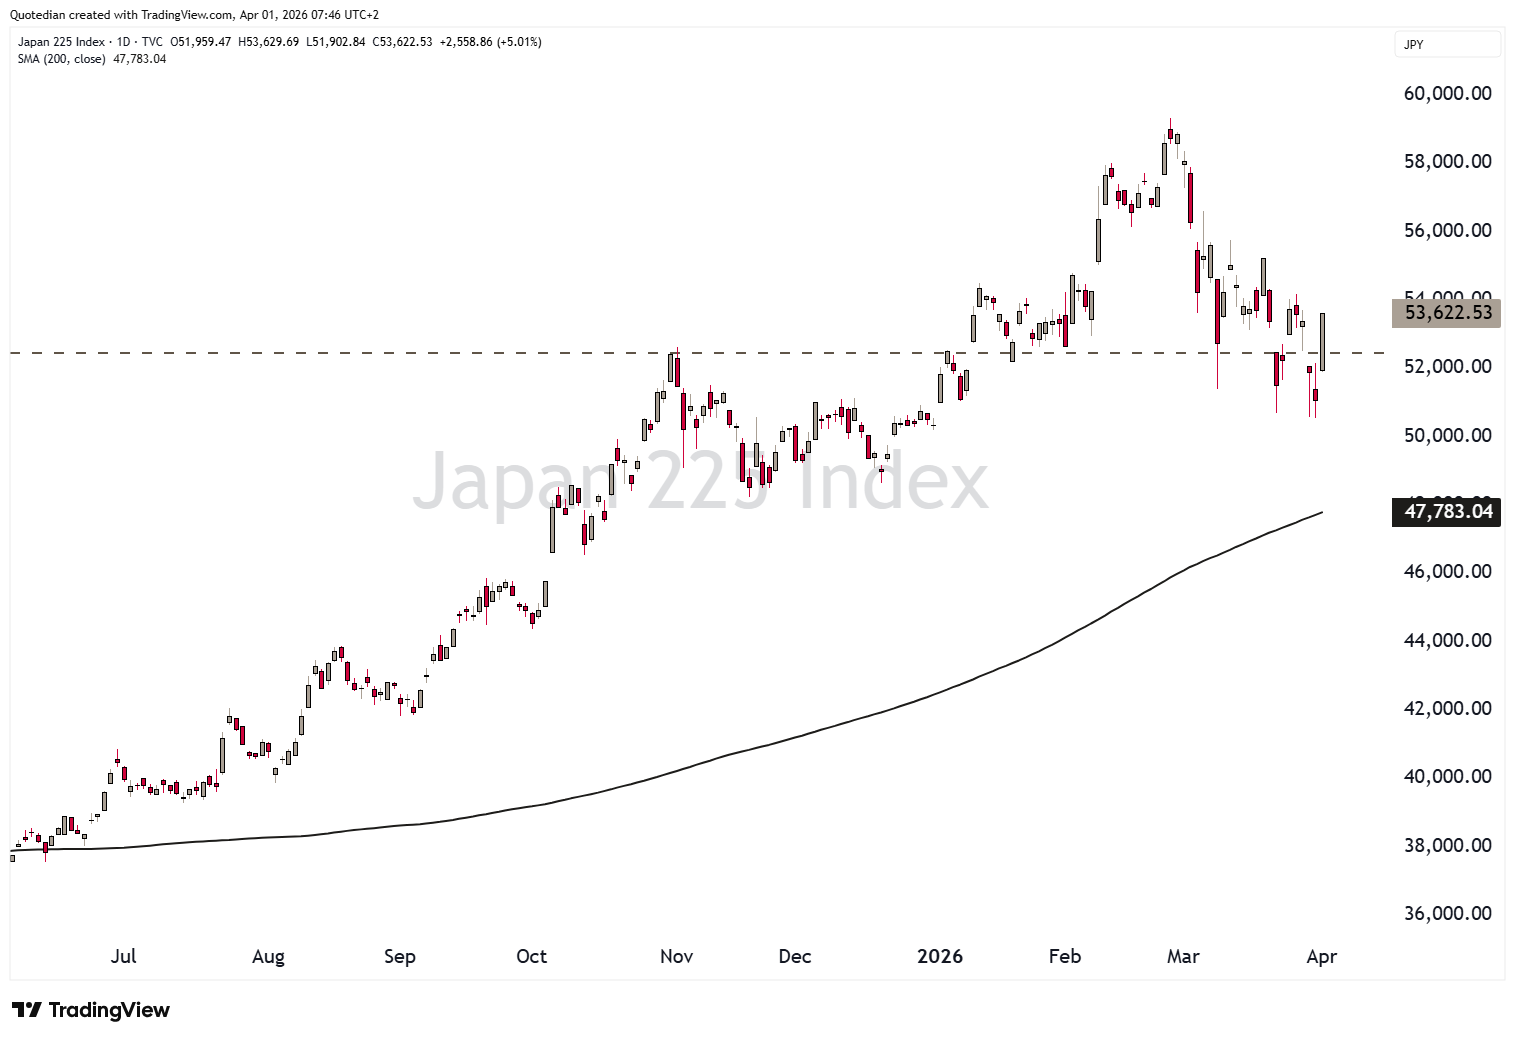
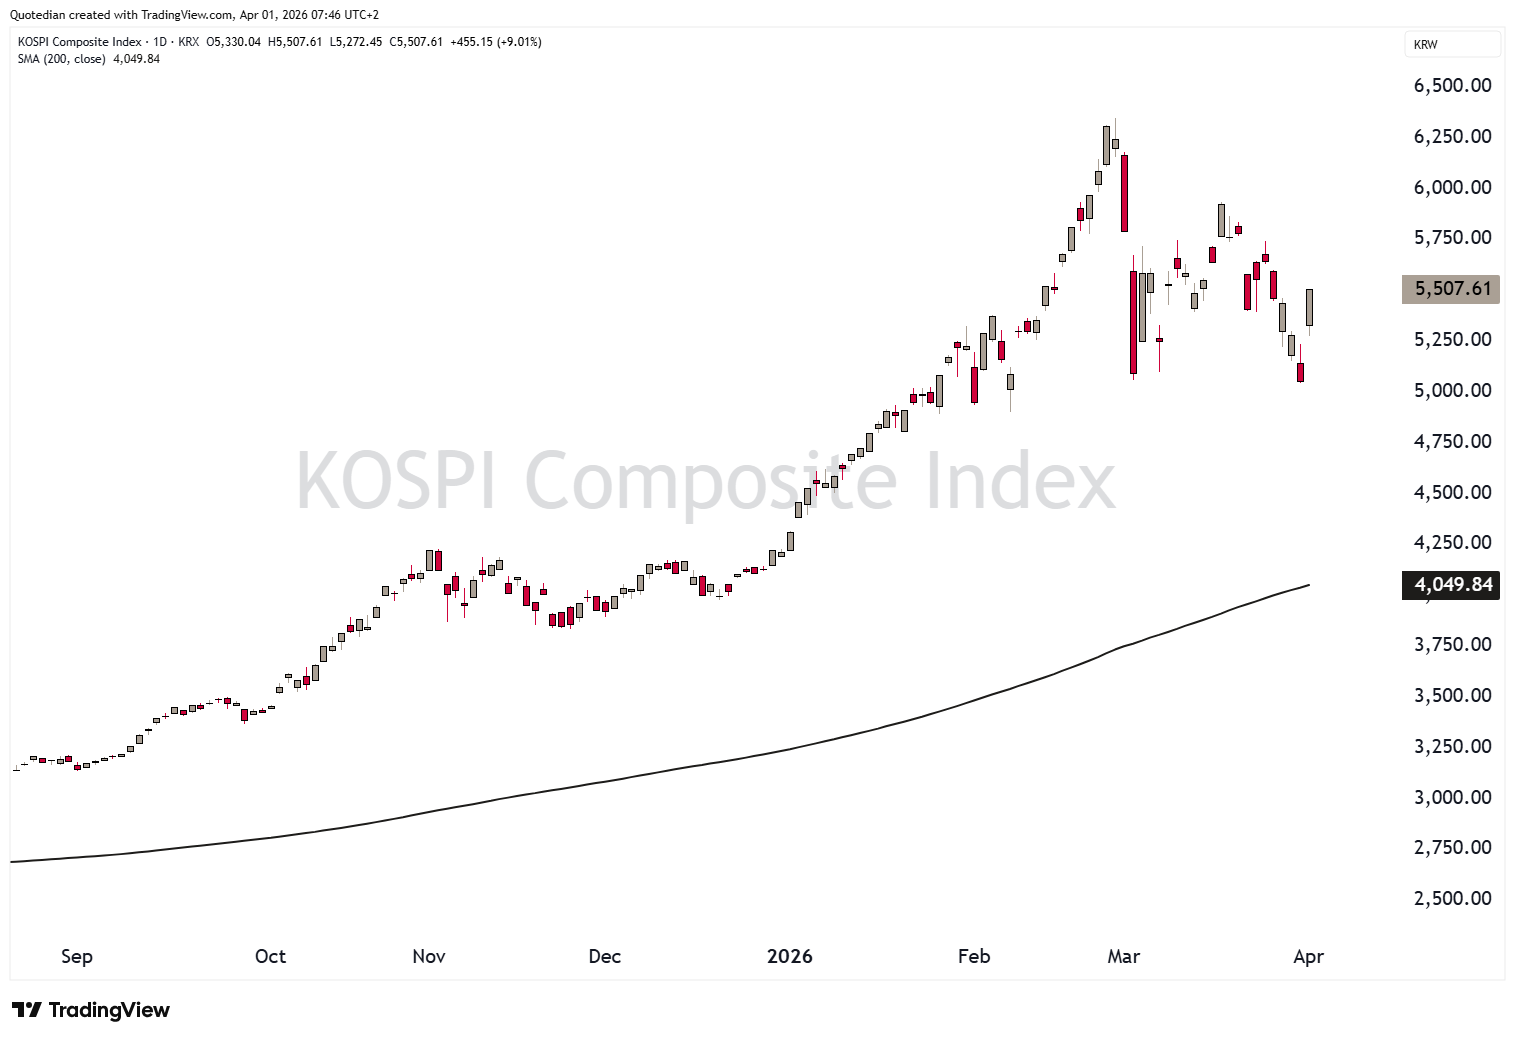
Asian markets are, not surprisingly, strongly higher this early Wednesday morning too, lead by a crazy five percent move higher in Japan’s Nikkei 225 index,
and rounded off by an Utopian 9% advance on Korea’s KOSPI:
Turning to bond markets, yields have come down, maybe not a long way, but decently from the intraday highs only last Thursday. Here’s the 10-Year US Treasury yield chart:

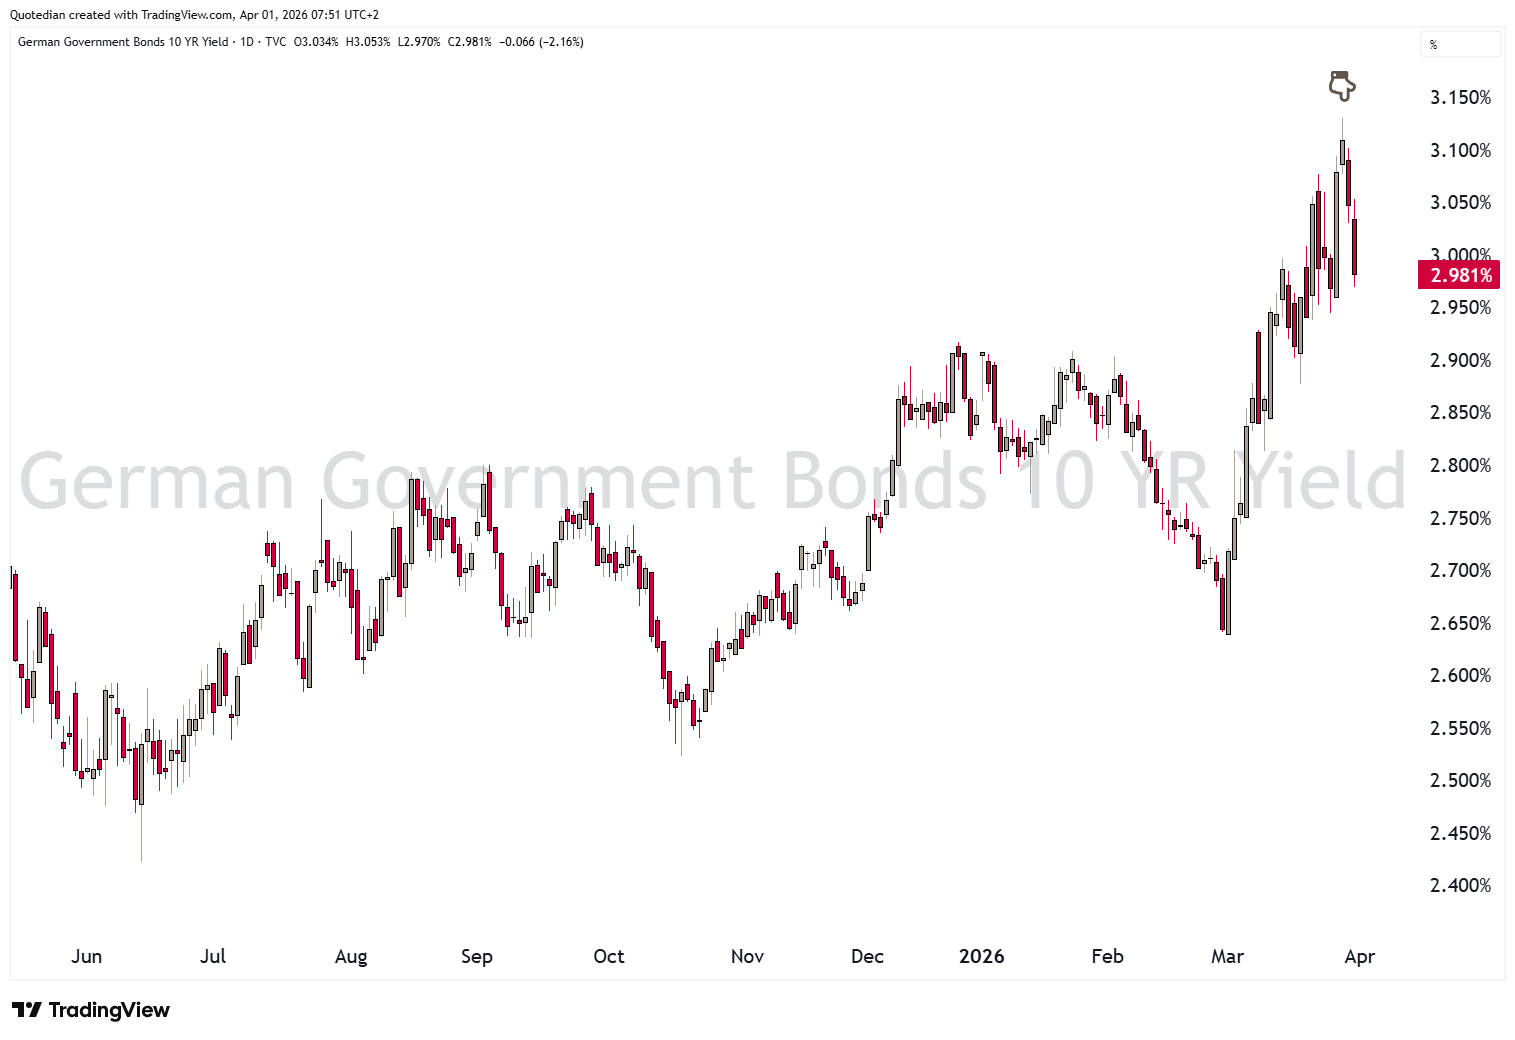
And here its German equivalent as a proxy for European yield markets (which had hit their cycle highs on Friday rather than Thursday):
So, as it seems to be not only April Fools’ Day, but also Uno Reverse Card Day,

it follows then that if stocks are higher and bond yields lower, the USD should also be weaker:
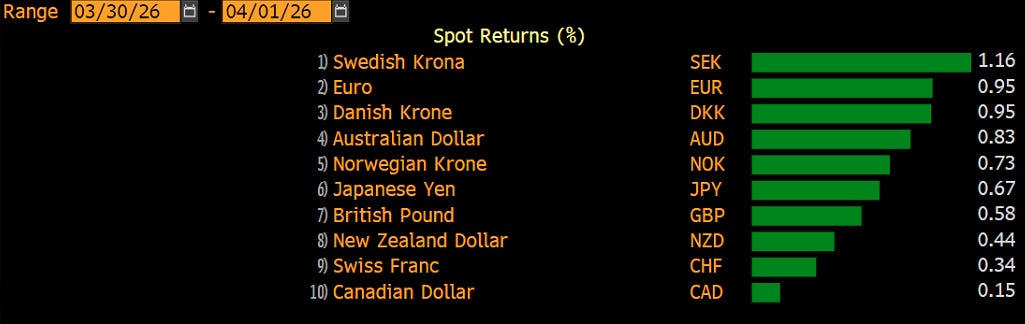
BINGO!
It follows then that the Dollar Index (DXY) has been rejected once again at the upper end of its range:
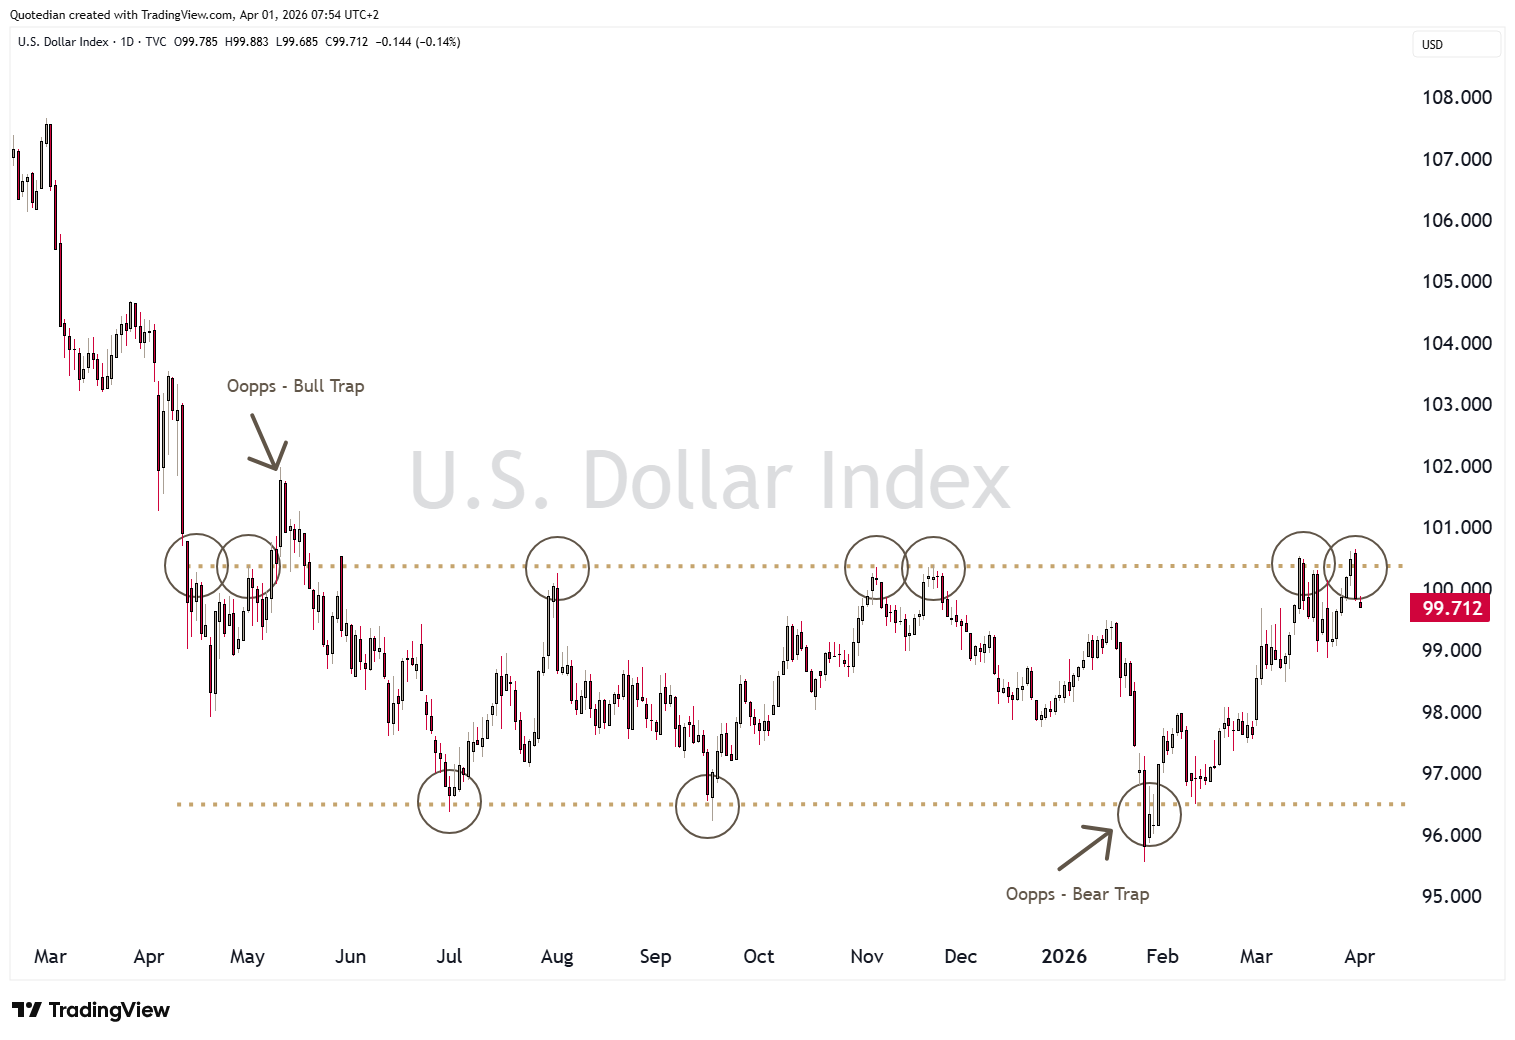
Also, BINGO.
Last but not least, in the commodity space, crude oil (Brent) futures have also come down over the past session,
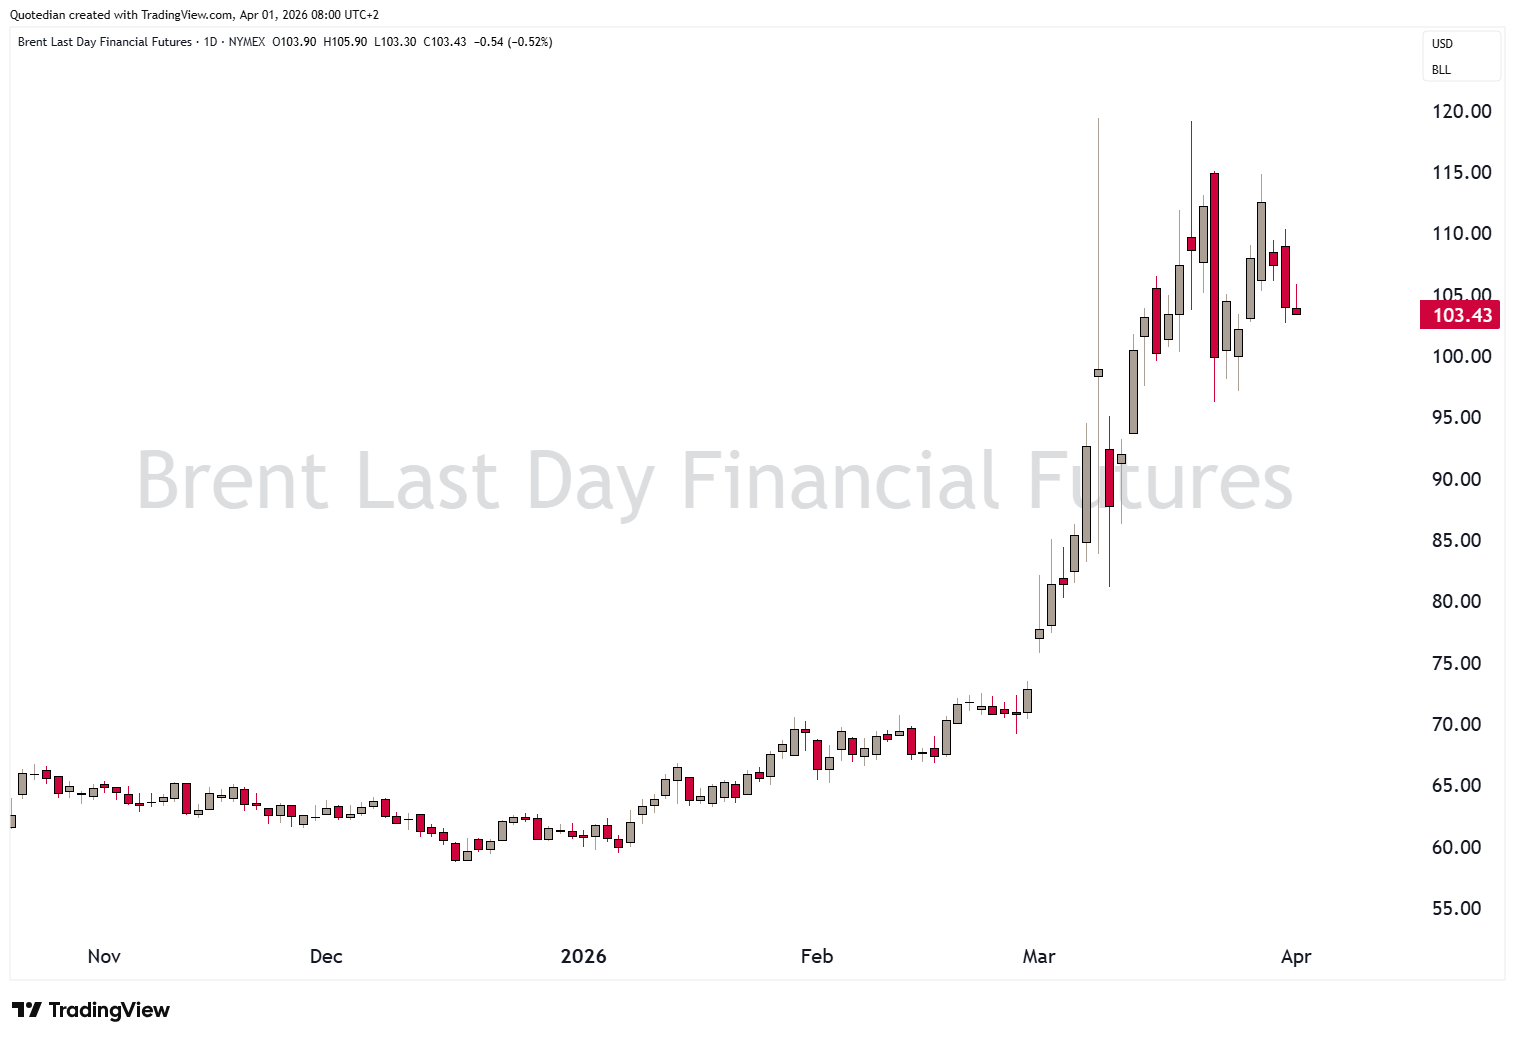
but given the uncertainty surrounding the opening or not of the Strait of Hormuz remain above the USD100 mark for now. A drop below would be a tell sign of an improving Strait situation.
Gold (red), as mentioned in Monday’s Quotedian (click here), are profiting from now falling real rates (grey, inverted):
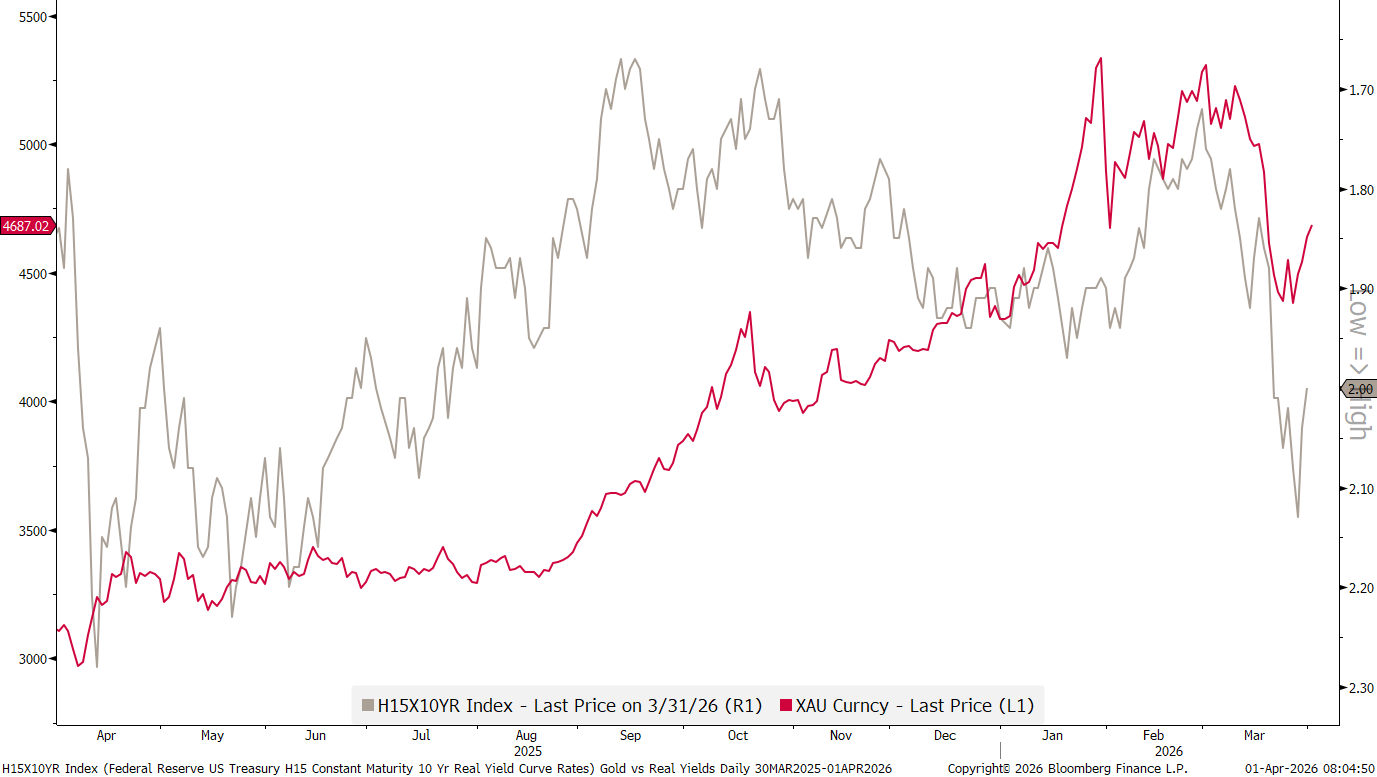
And already mentioned two weeks ago (click here), we expect this rally to have legs:
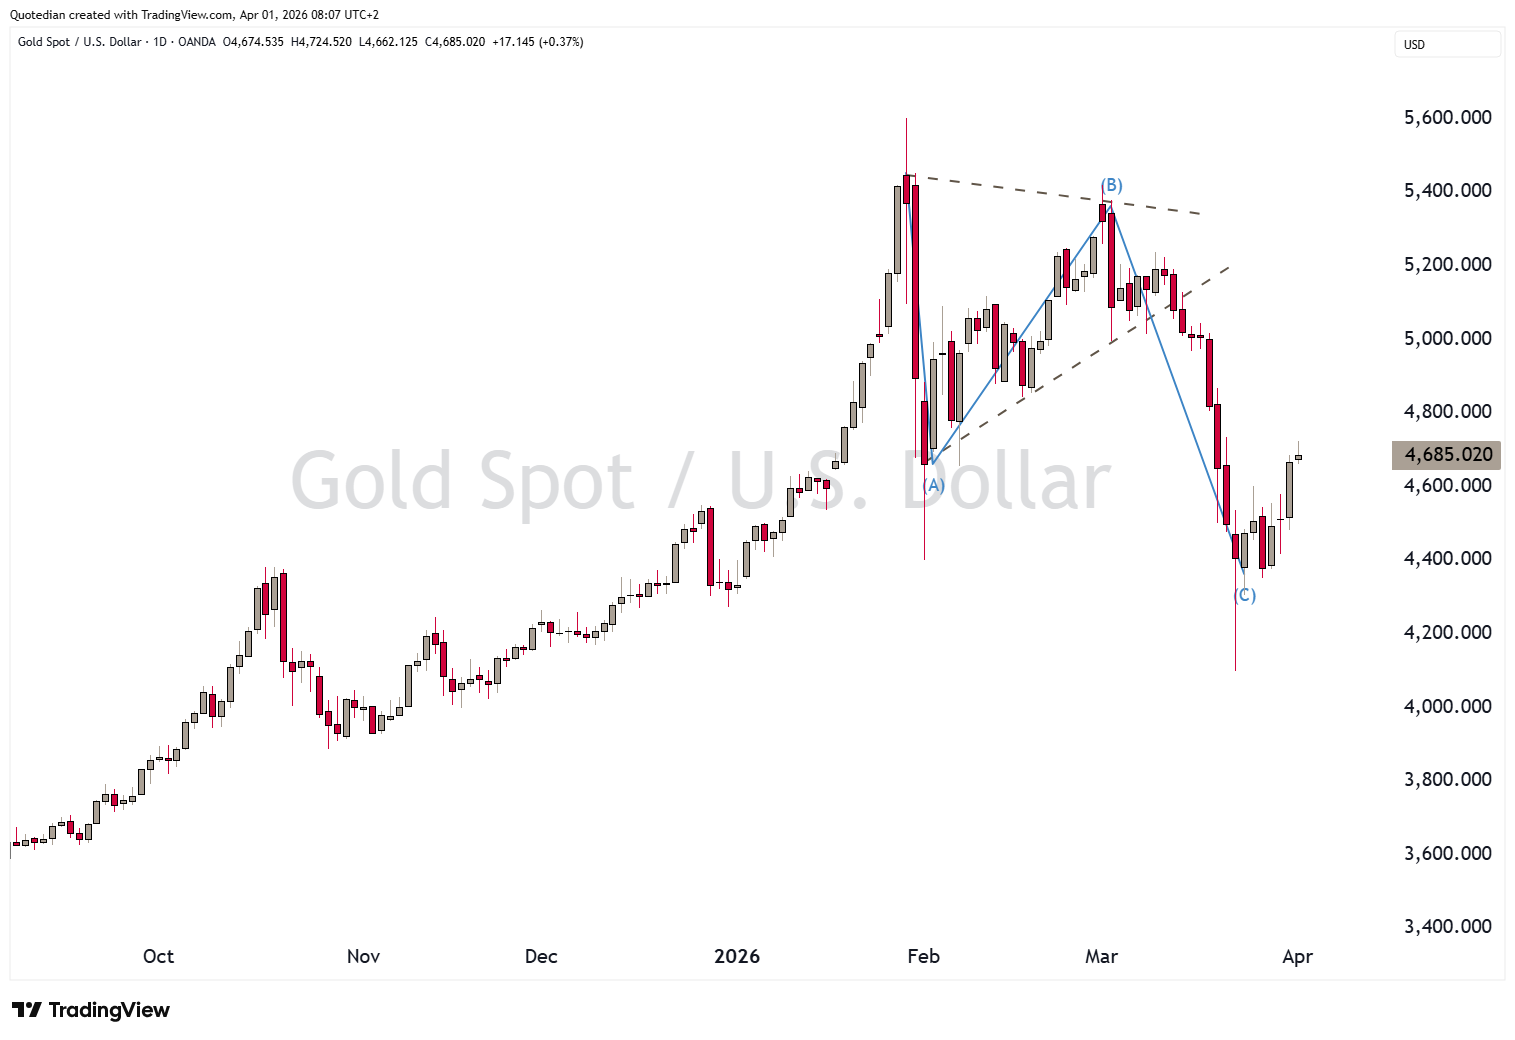
A potential ABC pattern may have terminated, which should take the price of gold first to 4,800 and then 4,920. The longer term picture would suggest a new ATH over the coming months. All bets off below 4,350.

Were oil traders right all that time? Is the conflict (and the closure of the Strait) really only “transitory”.
As shown in the spread between first month and the twelve month futures prices of Brent, traders bet up the price of short-term oil, but were/are confident that 12-months out oil will be much cheaper:
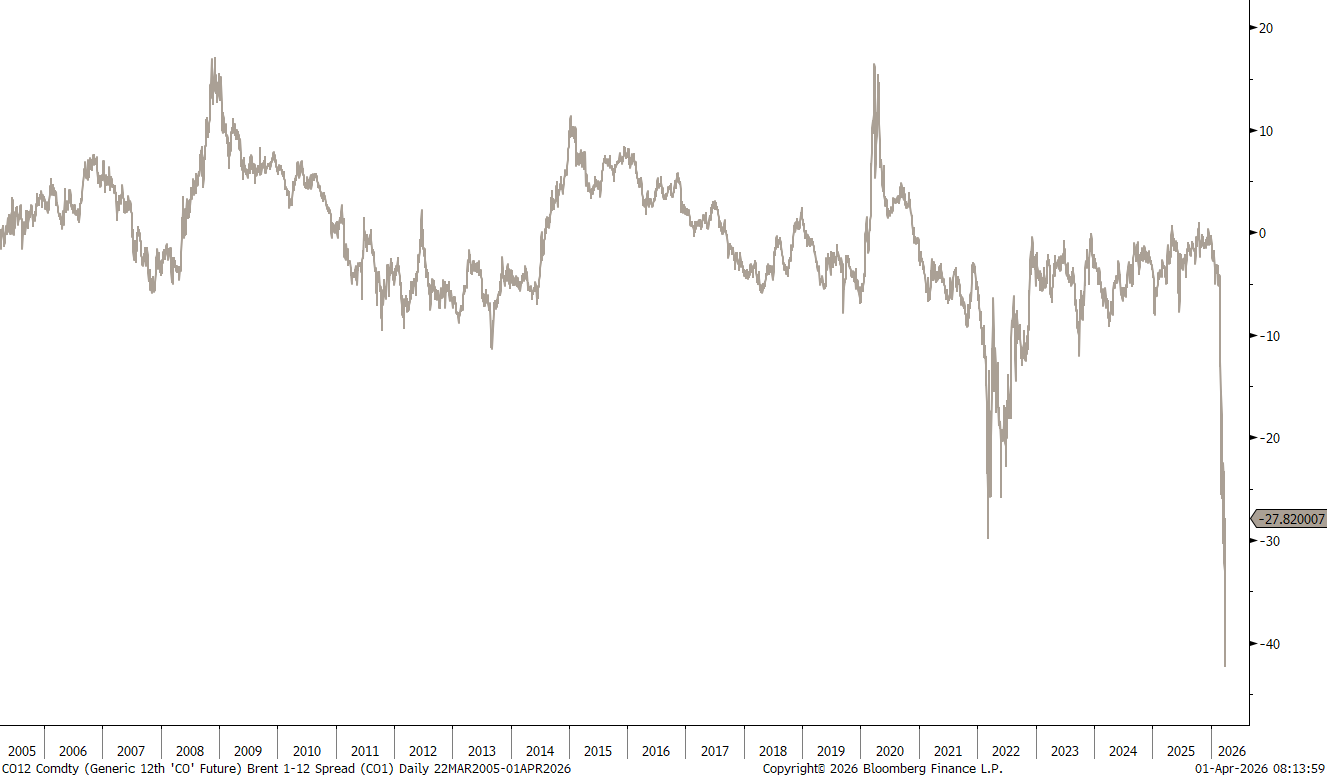
This is known as that famous Backwardation (with Contango being the contrary, where futures prices are higher the further out you go).
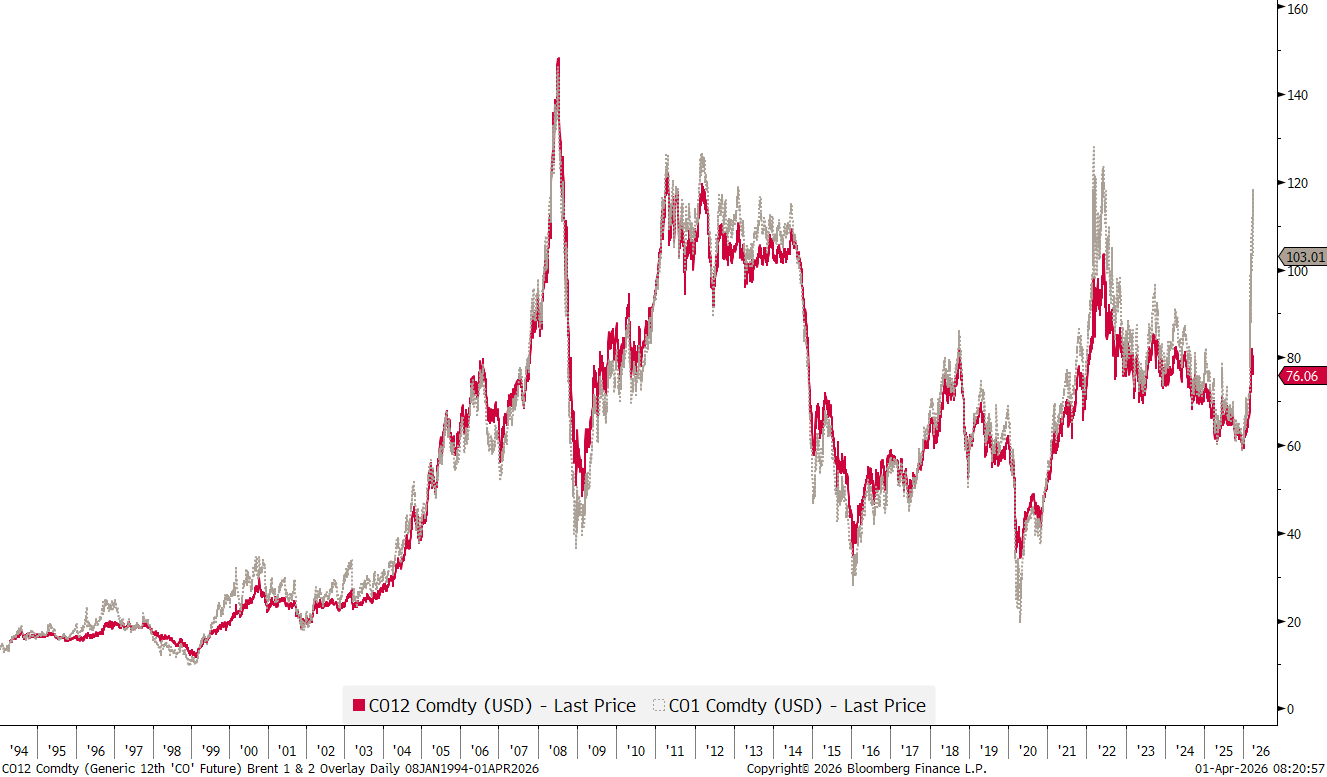
If this is conceptually difficult to grasp, here’s a nice chart overlaying those two contracts (grey 1-month, red 12-month), showing the confidence expressed by traders for this to be transitory, with the 12-month price staying way behind the 1-month price:

Couple of “things” out today, with the ADP employment report ahead of Friday's non-farm payroll figures and the ISM readings in the US probably the most important from an economic data point of view.
But, hand on heart, the only item that probably really matters on today’s agenda is Trump addressing the Nation on Iran at 21:00 ET. Unfortunately, this will be 3 a.m. for us in Europe here, but hey, if we stay up for the Super Bowl Final and the Oscars …
With all this said, always remember:
"April 1. This is the day upon which we are reminded of what we are on the other 364."
— Mark Twain
May the Trend be with You (and the jokes light on you).
André

Everything in this document is for educational purposes only (FEPO)
Nothing in this document should be considered investment advice
Investing real money can be costly; don’t do stupid shit
Leave politics at the door—markets don’t care.
Past performance is hopefully no indication of future performance
The views expressed in this document may differ from the views published by NPB Neue Privat Bank AG