

The Q - Daily Edition
Bullmonia
“I can calculate the motion of heavenly bodies, but not the madness of people.”
— Sir Isaac Newton


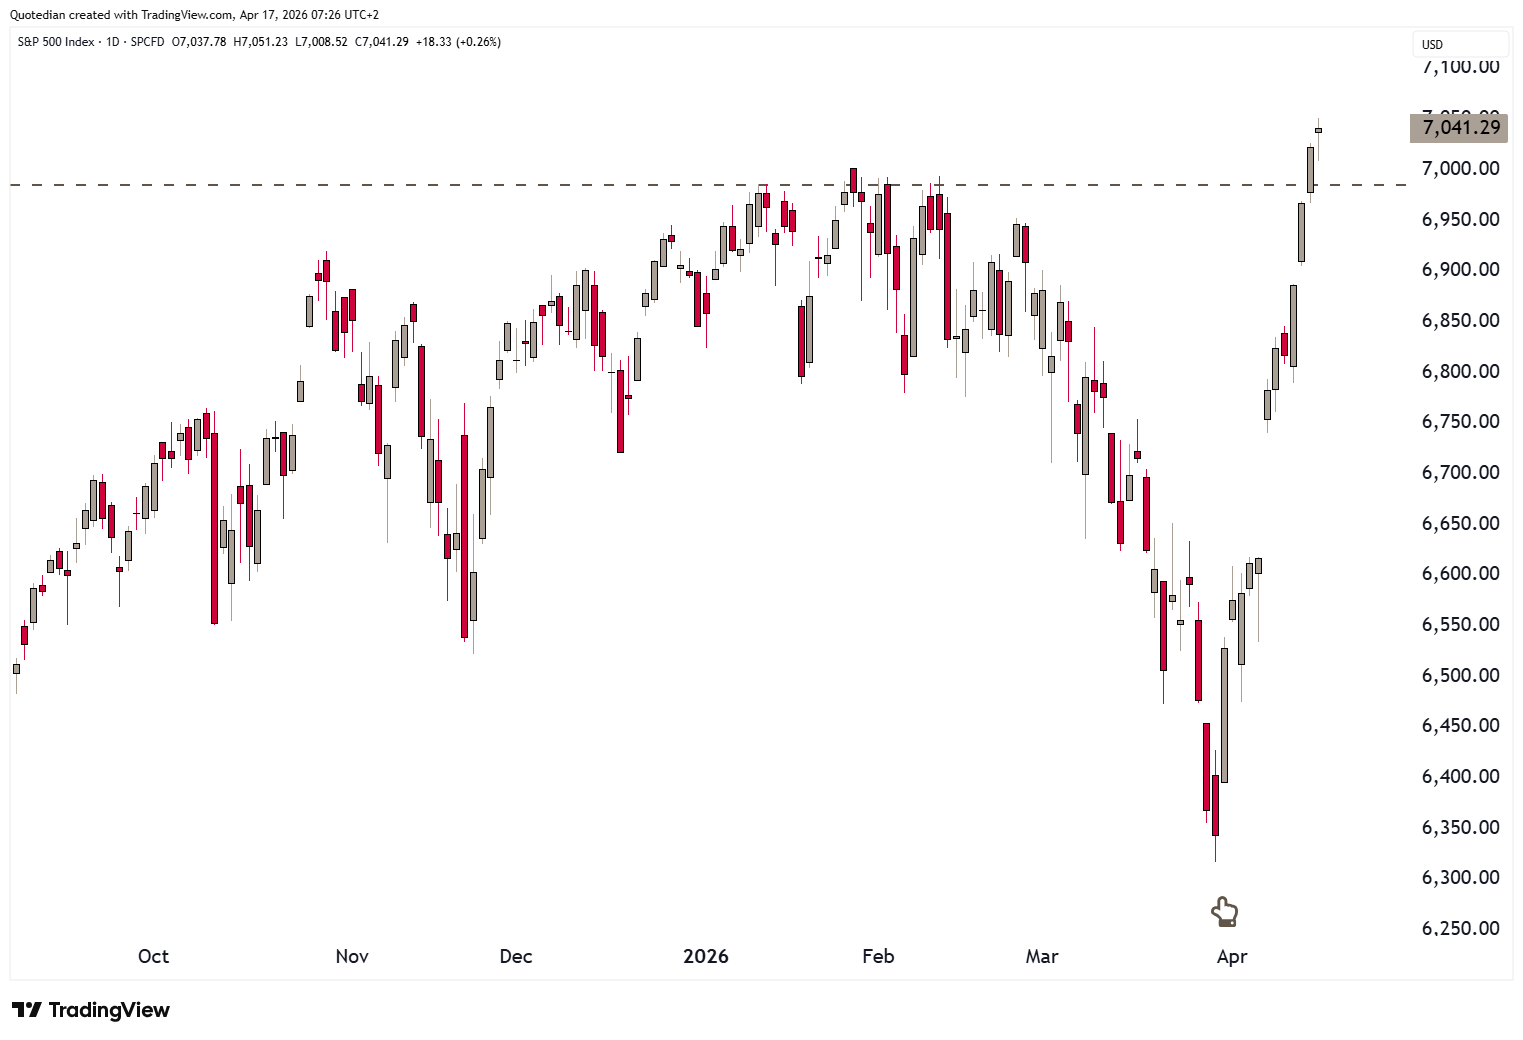
Stocks inched up yet another day, with the S&P 500 and the Nasdaq both closing at new ATHs. In case of the S&P 500, it was the second close above 7,000:
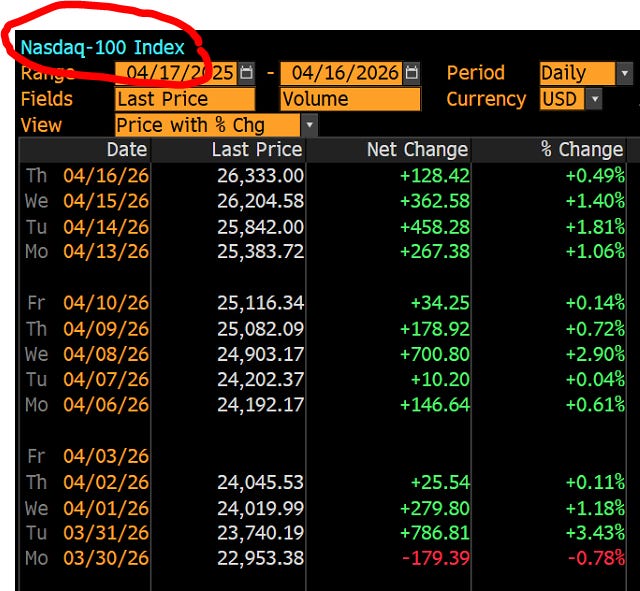
Whilst the Nasdaq celebrated its 12th(!) CONSECUTIRVE up day:
So, what has provoked this acute outbreak of Bullmonia?
Well, it is kind of a mix of different viruses, with some of the below being the most dominant components:
Retail buying (aka FOMO)
CTA buying (aka “Quants”)
Headline trading (aka Trump watchers, aka TDS (Trump Derangement Syndrome))
Gear (aka stupidity)
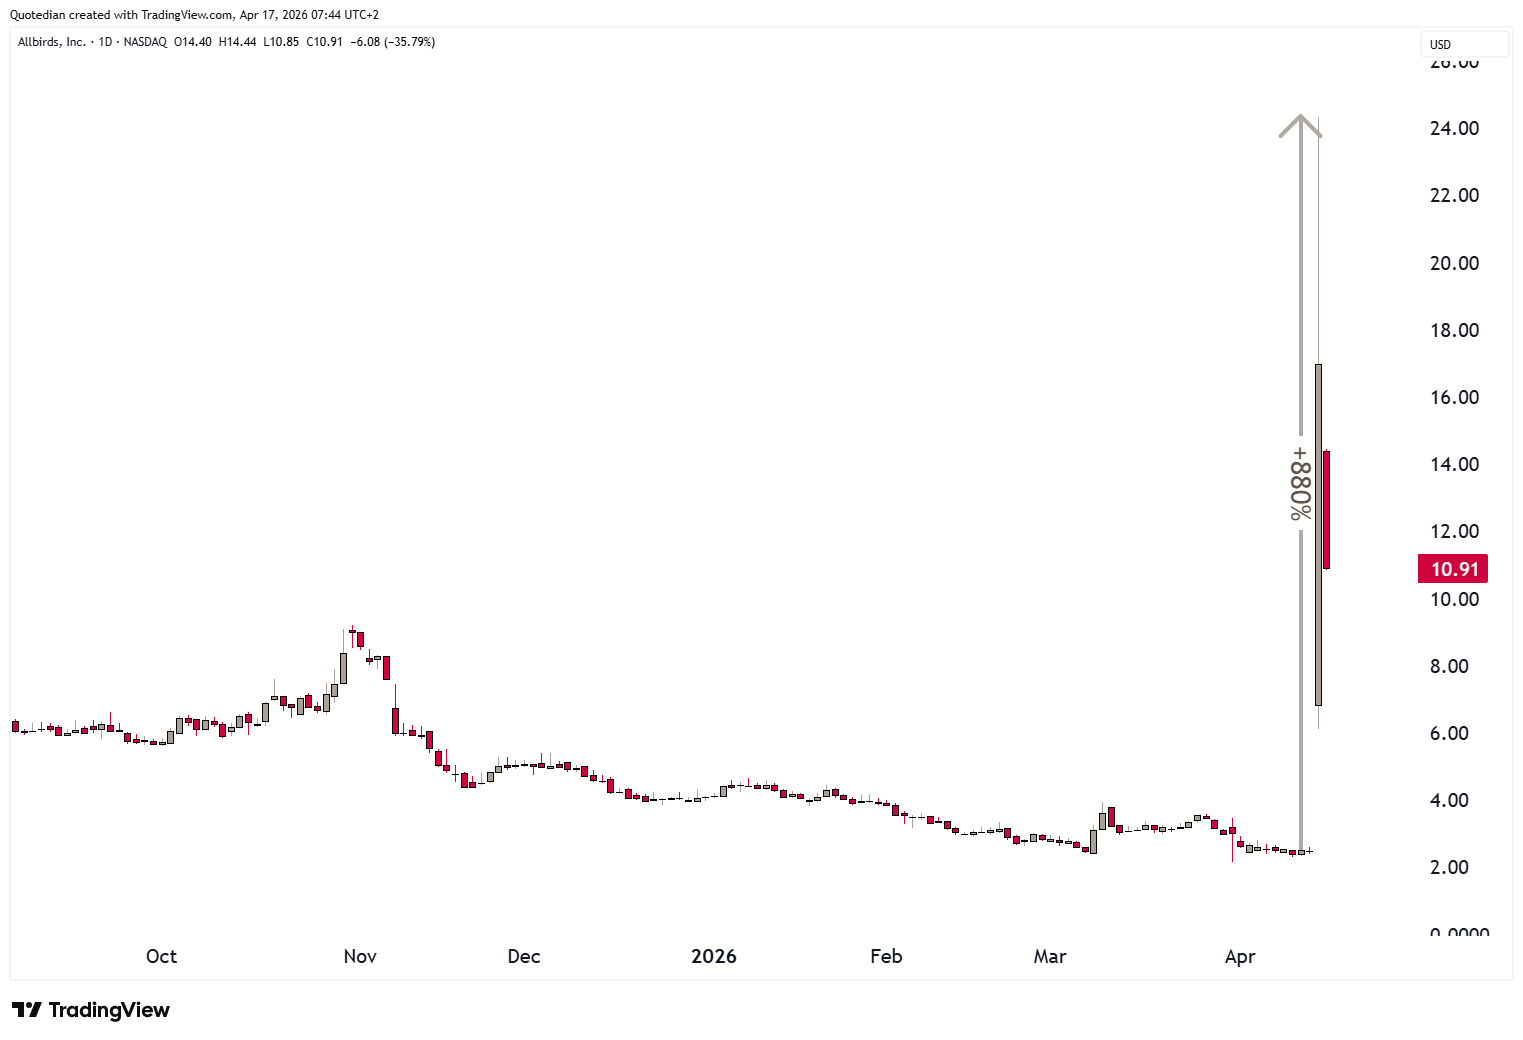
Prove on the latest is the easiest. Consider Allbirds (BIRD), a company providing sneakers, shoes, slip-ons, t-shirts, socks, underwear, bags, hats, and related products, which, out of the blue and announces it plans to ‘pivot its business to AI compute infrastructure’. That’s of course already stupid enough in itself, but was still outdone by the markets’ reaction:

Anyway, keeping this short on a Friday, Asian markets have stopped and slightly reversed the uptrend today, with an index measuring the fortunes of the wider region down about a percent.
This is an outcome I would expect for Western markets today too, as some profit taking should set in after that massive rally over the past two weeks and ahead of the weekend.
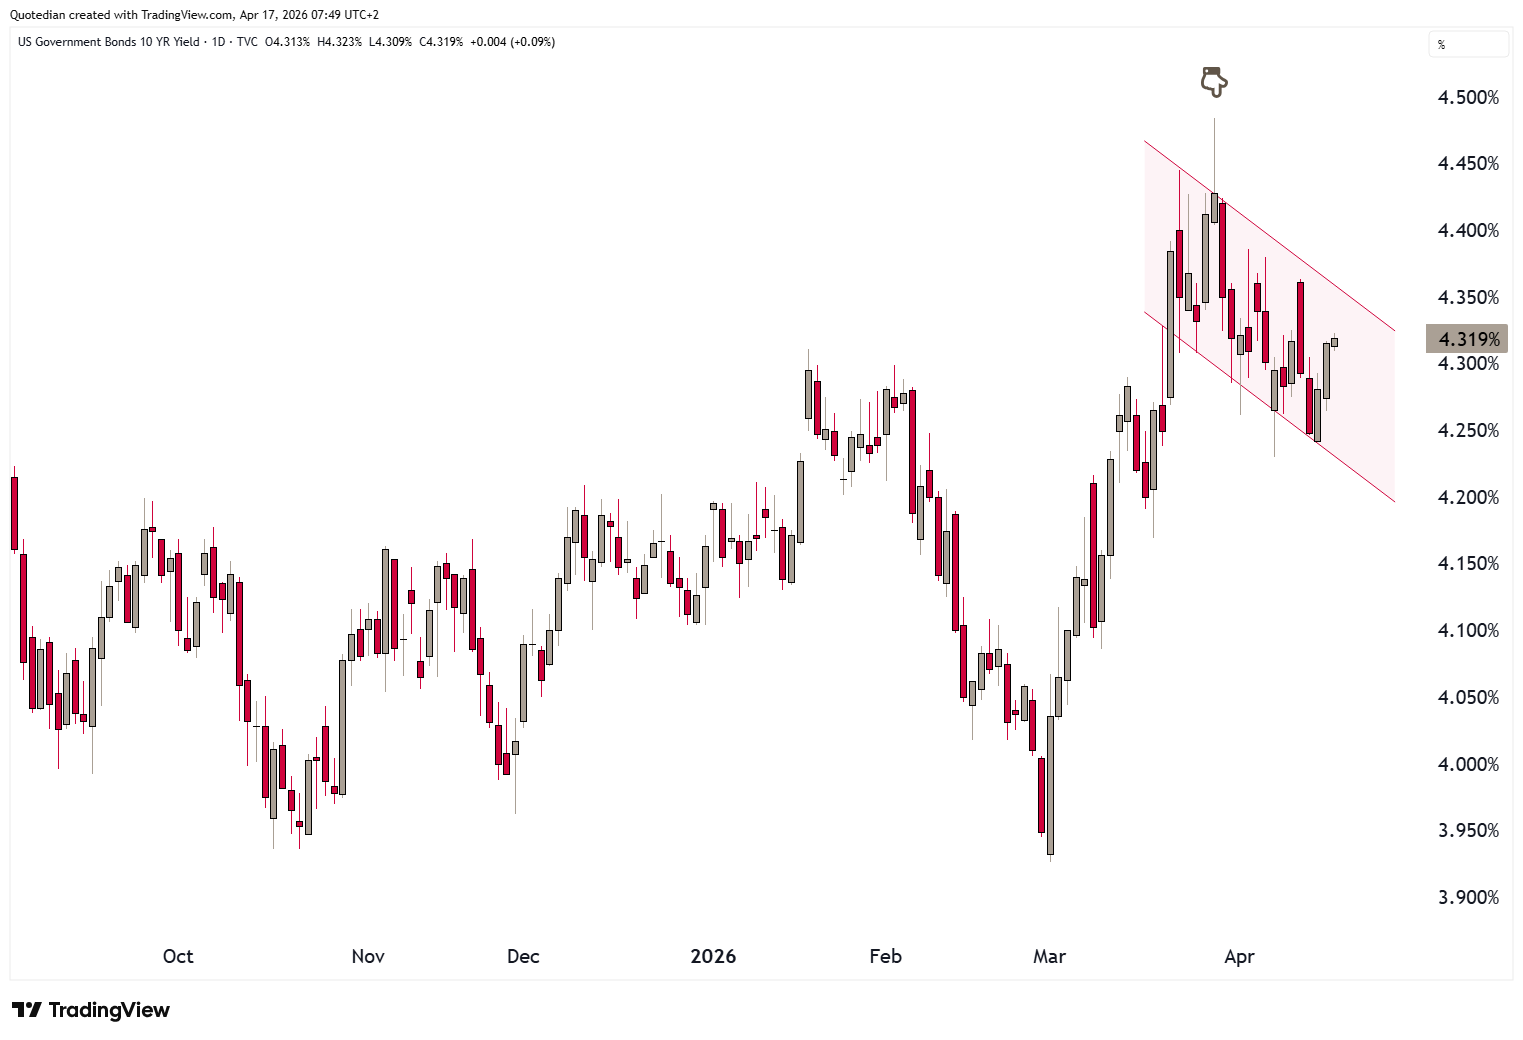
Bond yields (US 10-year Treasuries below) continue to trade within their downward slopping consolidation channel and absent any economic data out of the US we do not expect that to change today:
German yields have been more resilient to move lower after the spike and may be coiling up for a renewed break out, which could make sense in that the Eurozone is more affected by the inflationary impact from the closure of the Strait of Hormuz:
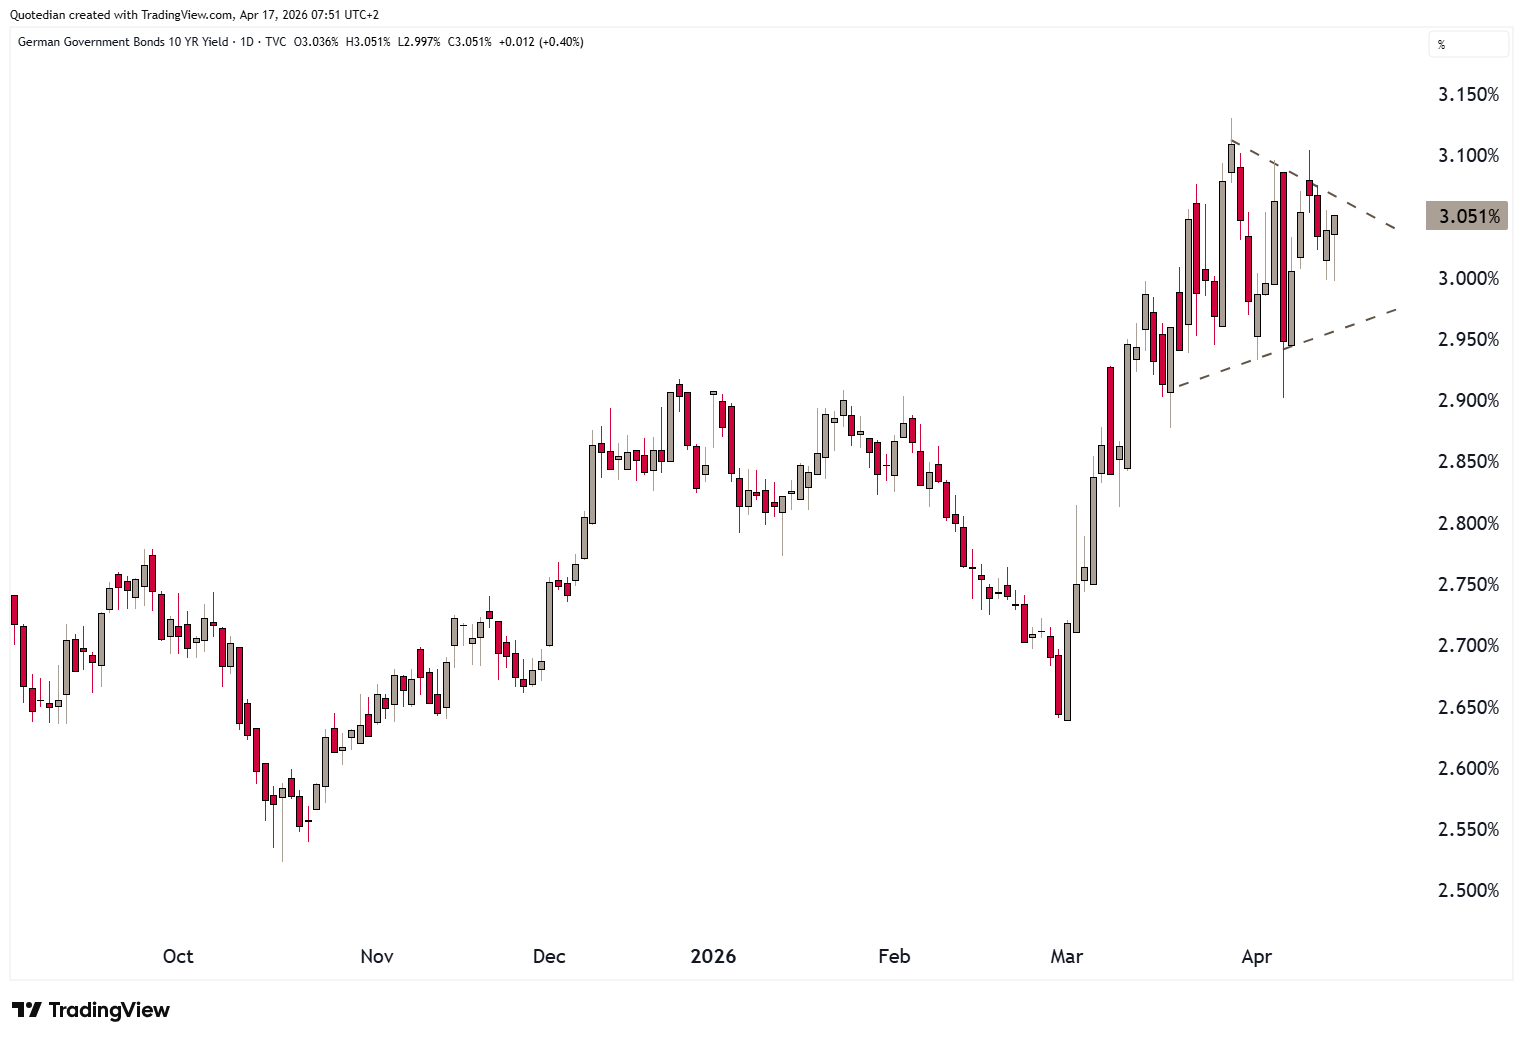
In that context, also pay close attention to our COTD below.
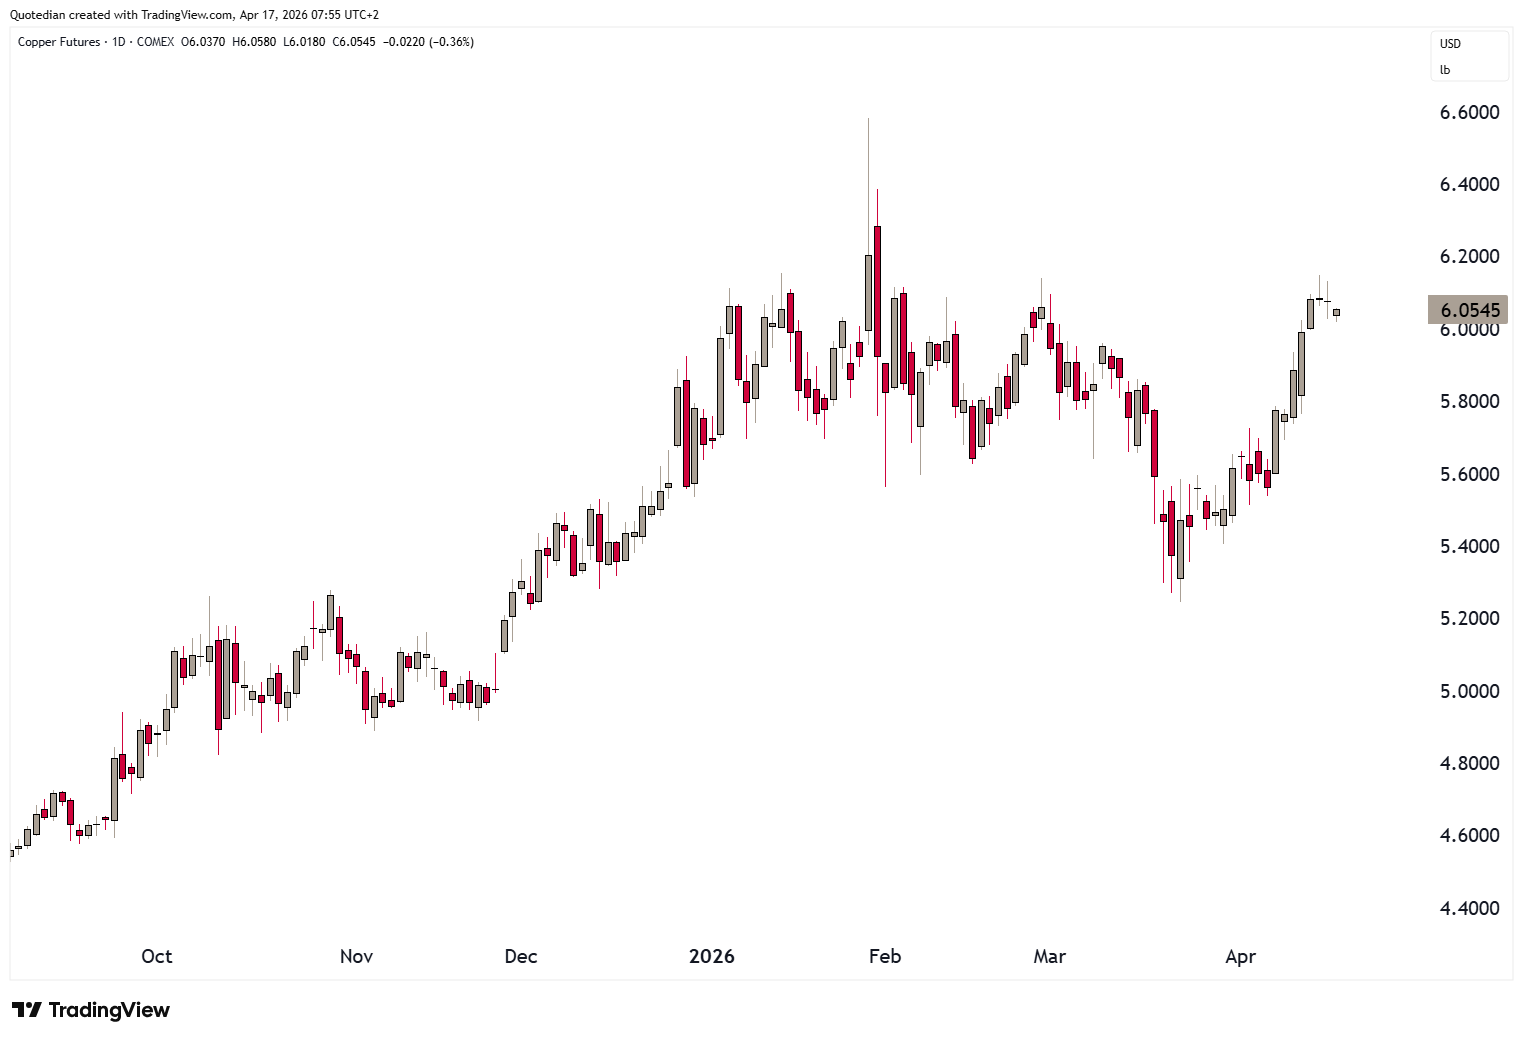
Little to report from currency OR commodity markets, other than maybe that copper futures have been moving higher lately, speaking of a strong economy which could exhibit additional upside pressure on stocks and downside pressure on bonds:

Interesting chart here from the fine folks at Barclays Research, showing the correlation of different asset classes and their subindices to the price in oil since the start of the Iran war:
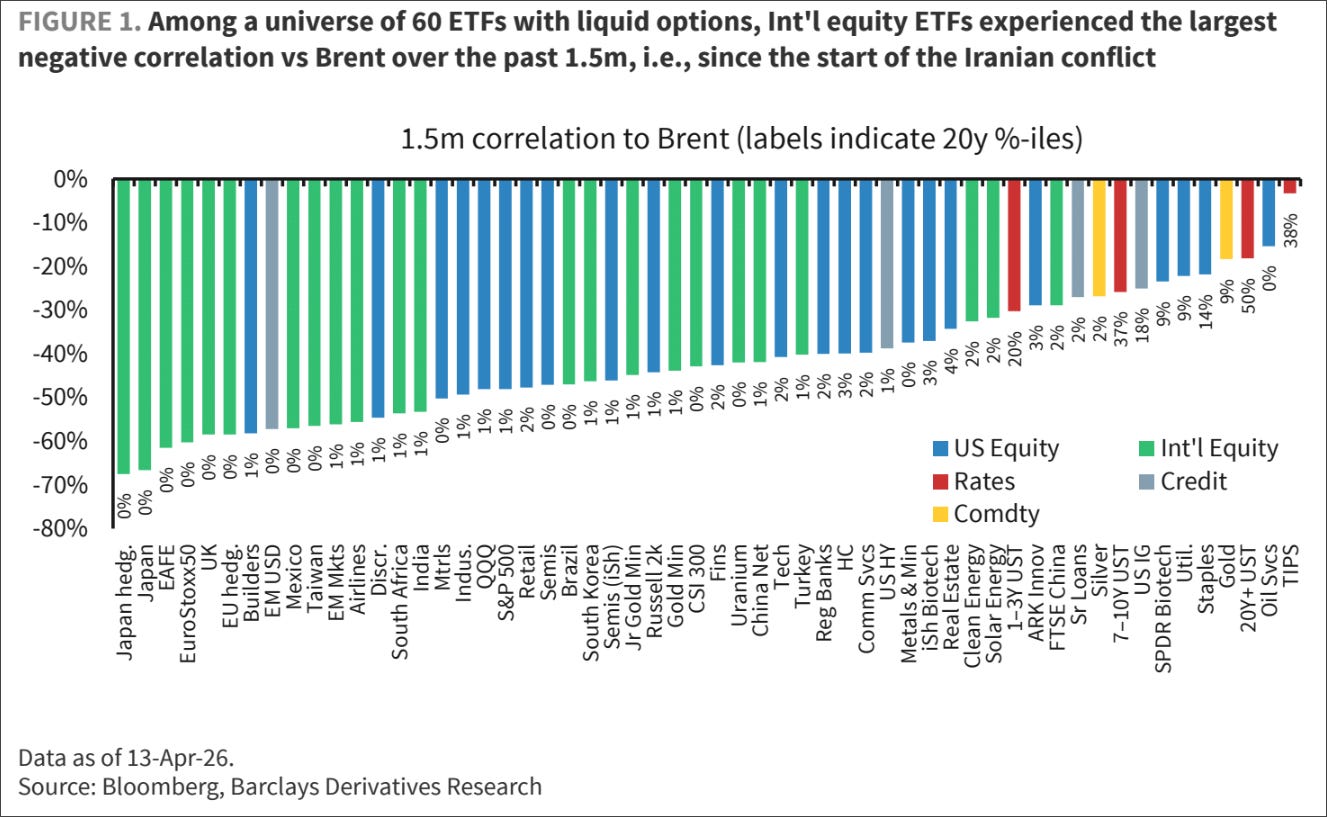
Unsurprisingly, international equity market exhibit the strongest (negative) correlation to oil.

With nothing of importance on the economic and only little (Ericsson, State Street, Truist Financials) on the earnings calendar it is time to clean out the inbox, catch-up on admin, square out some positions and head off into the weekend!
May the Trend be With You!
André

Everything in this document is for educational purposes only (FEPO)
Nothing in this document should be considered investment advice
Investing real money can be costly; don’t do stupid shit
Leave politics at the door—markets don’t care.
Past performance is hopefully no indication of future performance
The views expressed in this document may differ from the views published by NPB Neue Privat Bank AG